Aggregate Data
Aggregating Time series
The menu allows to perform a temporal aggregation. For example, if you have daily data, you can aggregate into pentad, dekadal, monthly or seasonal data.
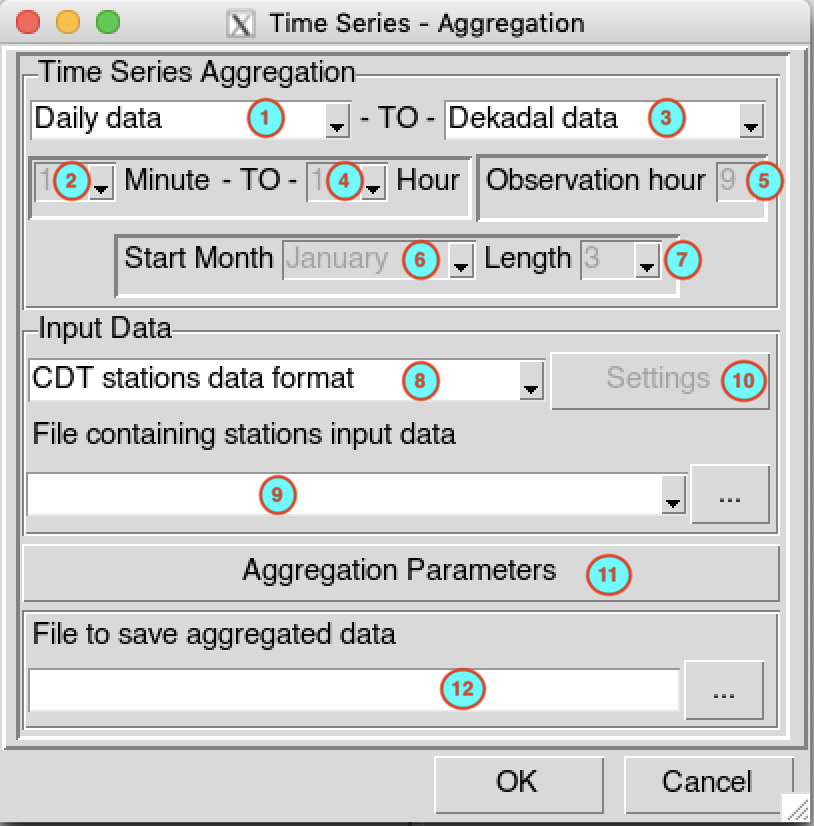
Select the temporal resolution of the input data to aggregate. Valid options: minutes, hourly, daily, pentad, dekadal or monthly data.
In case of minutes and hourly, select here the time step of the input data.
Select the temporal resolution in which the data will be aggregated.
- Minutes: If the time step of input is minutes (5, 10, 15 and 30), you can aggregate it to a minutes data with a time step greater than the input.
- Hourly: If the time step of input is minutes (5, 10, 15 and 30) or hourly (1, 3, 6 and 12), you can aggregate it to a hourly data with a time step greater than the input for hourly input data.
- Daily: If the time step of input is minutes (5, 10, 15 and 30) or hourly (1, 3, 6 and 12), you can aggregate it to a daily data.
- Pentad: If the time step of input is daily, you can aggregate it to a pentadal data. There are 6 pentads in a calendar month. The pentad must be 1, 2, 3, 4, 5 or 6; pentad 1 (contains the days from the 1st to 5th), pentad 2 (6th to 10th), pentad 3 (11th to 15th), pentad 4 (16th to 20th), pentad 5 (21st to 25th) and pentad 6 (26th to the end of the month).
- Dekadal: There are 3 dekads in a calendar month. The dekad must be 1, 2 or 3; dekad 1 (contains the days from the 1st to 10th), dekad 2 (11th to 20th) and dekad 3 (21st to the end of the month).
- Monthly: The data will be aggregated monthly.
- Annual: The data will be aggregated from January to December for each year.
- Seasonal: The data will be aggregated for each season of the year. The length of the season varies from 2 to 12 months.
- Rolling Seasonal: The data will be aggregated over a rolling season. For example, for a seasonal data with 3 months length, the following seasons will be calculated for each year: JFM (January-February-March), FMA, MAM, AMJ, MJJ, JJA, JAS, ASO, SON, OND, NDJ, DJF.
If the outputs are minutes or hourly, select the time step of the aggregated data.
If the inputs are minutes (5, 10, 15 and 30) or hourly (1 and 3) and the output time step is daily, specify here the observation hour to compute the daily data. Use 24-hour time format (0 to 23). For example, for daily rainfall observed at 9:00, set this value to 9, the cumulative rainfall recorded on 2018-07-30 at 9:00 is the rainfall for the day 2018-07-29.
If the outputs are seasonal, select the start month of the season.
If the outputs are seasonal or rolling seasonal, select the length of the season.
Select the input data format to aggregate. Available data formats are: CDT stations data format, CDT dataset format (gridded) and NetCDF gridded data.
If the input data is a CDT station data format, select from the drop-down list the file containing the station data to be aggregated if it is already loaded, or open it from the browse button
 on the
right. If the input data is a CDT dataset format
(gridded), type the full path to the index file of the CDT
dataset or browse it. In case of NetCDF gridded
data, type the full path to the folder containing the
netCDF files or browse it.
on the
right. If the input data is a CDT dataset format
(gridded), type the full path to the index file of the CDT
dataset or browse it. In case of NetCDF gridded
data, type the full path to the folder containing the
netCDF files or browse it.In case of NetCDF gridded data, click on the button . A dialog box will be displayed in which you can set the date range, provide a sample file and change the filename format of the netCDF file. See Setting netCDF datasets parameters for more details.
Click on the button to select the function to use to aggregate the data and to set the minimum number of observations to compute one output time step. See Aggregation parameters to set the parameters in the dialog box.
If the input data is a CDT station data format, type the name of the file to save the aggregated data or the full path to the file or browse it from the button
on the right. For CDT
dataset format (gridded) and NetCDF gridded
data, type the full path to the folder to save the
aggregated data or browse with the button .
When everything is set up click OK and click on the button  to aggregate the data.
For CDT dataset format (gridded) and NetCDF gridded data, the aggregated data are saved in a new folder in the form Aggregated_Data_<function used to aggregate> under the folder you provided to save the output in (12).
Finding minimum and maximum with the observation dates
The menu allows to find the minimum or maximum of a variables with the dates when the value occurred for a given output time step.
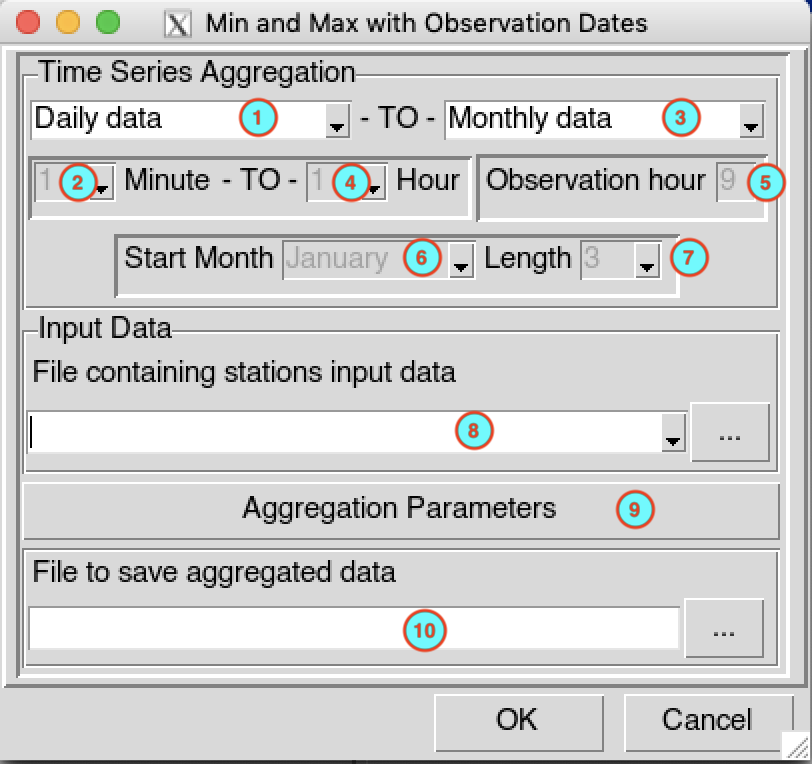
Select the temporal resolution of the input data. Valid options: minutes, hourly, daily, pentad, dekadal or monthly data.
In case of minutes and hourly, select here the time step of the input data.
Select the temporal resolution in which the minimum or maximum will be searched.
If the outputs are minutes or hourly, select the time step of the output data.
If the inputs are minutes (5, 10, 15 and 30) or hourly (1 and 3) and the output temporal resolution is daily, specify here the observation hour to compute the daily data. Use 24-hour time format (0 to 23).
If the outputs are seasonal, select the start month of the season.
If the outputs are seasonal or rolling seasonal, select the length of the season.
Select from the drop-down list the file containing the station data (in CDT station data format) in which the minimum or maximum observations will be searched if it is already loaded, or open it from the browse button
on the right.Click on the button to select the function to use and to set the minimum number of observations to compute one output time step. See Aggregation parameters to set the parameters in the dialog box.
Enter the file name to save the output or the full path to the file or browse it from the button
on the right.
When everything is set up click OK, then click on the button .
It created two files containing the minimum or maximum and the dates
when those values were observed. For example, to find the maximum of
daily maximum temperature for each month and you provide the file name
Monthly_Maximum_Tmax_1981-2020.csv in
(10), you will have two files:
- Monthly_Maximum_Tmax_1981-2020.csv: this file
contains the value of the maximum for daily maximum temperature for each
month
- Monthly_Maximum_Tmax_1981-2020_dates.csv: this file
contains the dates when the maximum was observed. If the maximum value
occurred on several days, all the dates will be included and separated
by a dash (-). For example:
20161007-20161012-20161026-20161031
Aggregating Time series - Moving window
The menu allows to perform a temporal aggregation with moving window. A moving window is a contiguous subset of a data that is used to compute local statistics. At each step, the window advances to include one new value and leaves off one old value.

Select the temporal resolution of the input data to aggregate. Valid options: minutes, hourly, daily, pentad, dekadal or monthly data.
In case of minutes and hourly, select here the time step of the input data.
Select the input data format to aggregate. Available data formats are: CDT stations data format, CDT dataset format (gridded) and NetCDF gridded data.
If the input data is a CDT station data format, select from the drop-down list the file containing the station data to be aggregated if it is already loaded, or open it from the browse button
on the
right. If the input data is a CDT dataset format
(gridded), type the full path to the index file of the CDT
dataset or browse it. In case of NetCDF gridded
data, type the full path to the folder containing the
netCDF files or browse it.In case of NetCDF gridded data, click on the button . A dialog box will be displayed in which you can set the date range, provide a sample file and change the filename format of the netCDF file. See Setting netCDF datasets parameters for more details.
Select the function to compute local statistics. Valid options:
- sum: computing the sum/total of a variable for a given time resolution
- mean: computing the mean/average of a variable for a given time resolution
- median: computing the median of a variable for a given time resolution
- sd: computing the standard variation of a variable for a given time resolution
- max: getting the maximum of a variable for a given time resolution
- min: getting the minimum of a variable for a given time resolution
- count: counting the number of occurrences where a variable is less/greater than a given threshold for a given time resolution
Enter here the window length, it’s the number of observations in the window to be used to compute the local statistics.
Specify the minimum number of non missing observations within the window length. If the number of non missing observation is less than this number the result will be missing.
Select the alignment to be used. Available options are:
- left: the first computed statistic is placed at the position of the first observation, if n is the window length, the n-1 last computed statistics are missing.
- center: the first computed statistic is placed at the center position of the length window, the first and last (n-1)/2 computed statistics are missing if n is odd, and the first (n-1)/2 and last n/2 computed statistics are missing if n is even.
- right: the first computed statistic is placed at the position of the n-th observation, the n-1 first computed statistics are missing.
If the input data is a CDT station data format, type the name of the file to save the result or the full path to the file or browse it from the button
on the right. For CDT
dataset format (gridded) and NetCDF gridded
data, type the full path to the folder to save the output
or browse with the button .
Click on the button to
start the computation.
For CDT dataset format (gridded) and NetCDF gridded data, the aggregated data are saved in a new folder in the form Aggregated_Rolling_<function used to aggregate> under the folder you provided to save the output in (10).