Data Extraction
To extract data from a netCDF dataset readable by CDT to a given spatial support such as a points, polygons or rectangle, use the menu . It will display a tabbed widget on the left panel, allows to enter the inputs data and parameters.
The tab Input allows to enter the inputs NetCDF data and the shapefile.
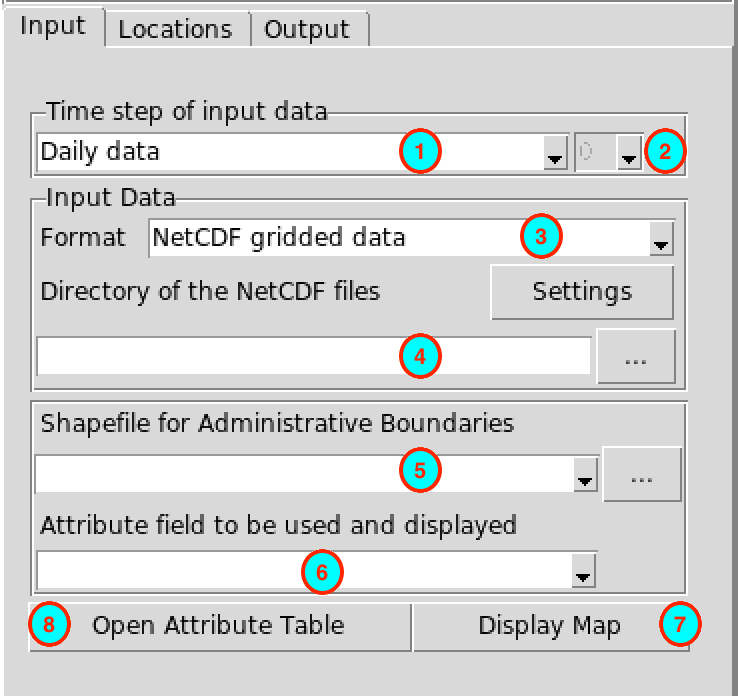
Select the temporal resolution of the input netCDF dataset to extarct. Valid options: minutes, hourly, daily, pentad, dekadal or monthly data.
In case of minutes and hourly, select here the time step of the input data.
Select the format of the input data. Available data formats are: NetCDF gridded data and CDT dataset format (gridded).
In case of NetCDF gridded data, type the full path to the folder containing the netCDF files or browse it, and click on the button to set the parameters of the netCDF dataset. In case of CDT dataset format (gridded), type the full path to the index file of the CDT dataset or browse it.
If you want to display a map to select the location to extract the data, provide here the shapefile to be displayed on the map. Select it from the drop-down list if it is already loaded, or open it from the browse button
 on the
right.
on the
right.Select the attribute to display on the status bar or to use when the extraction support is polygons.
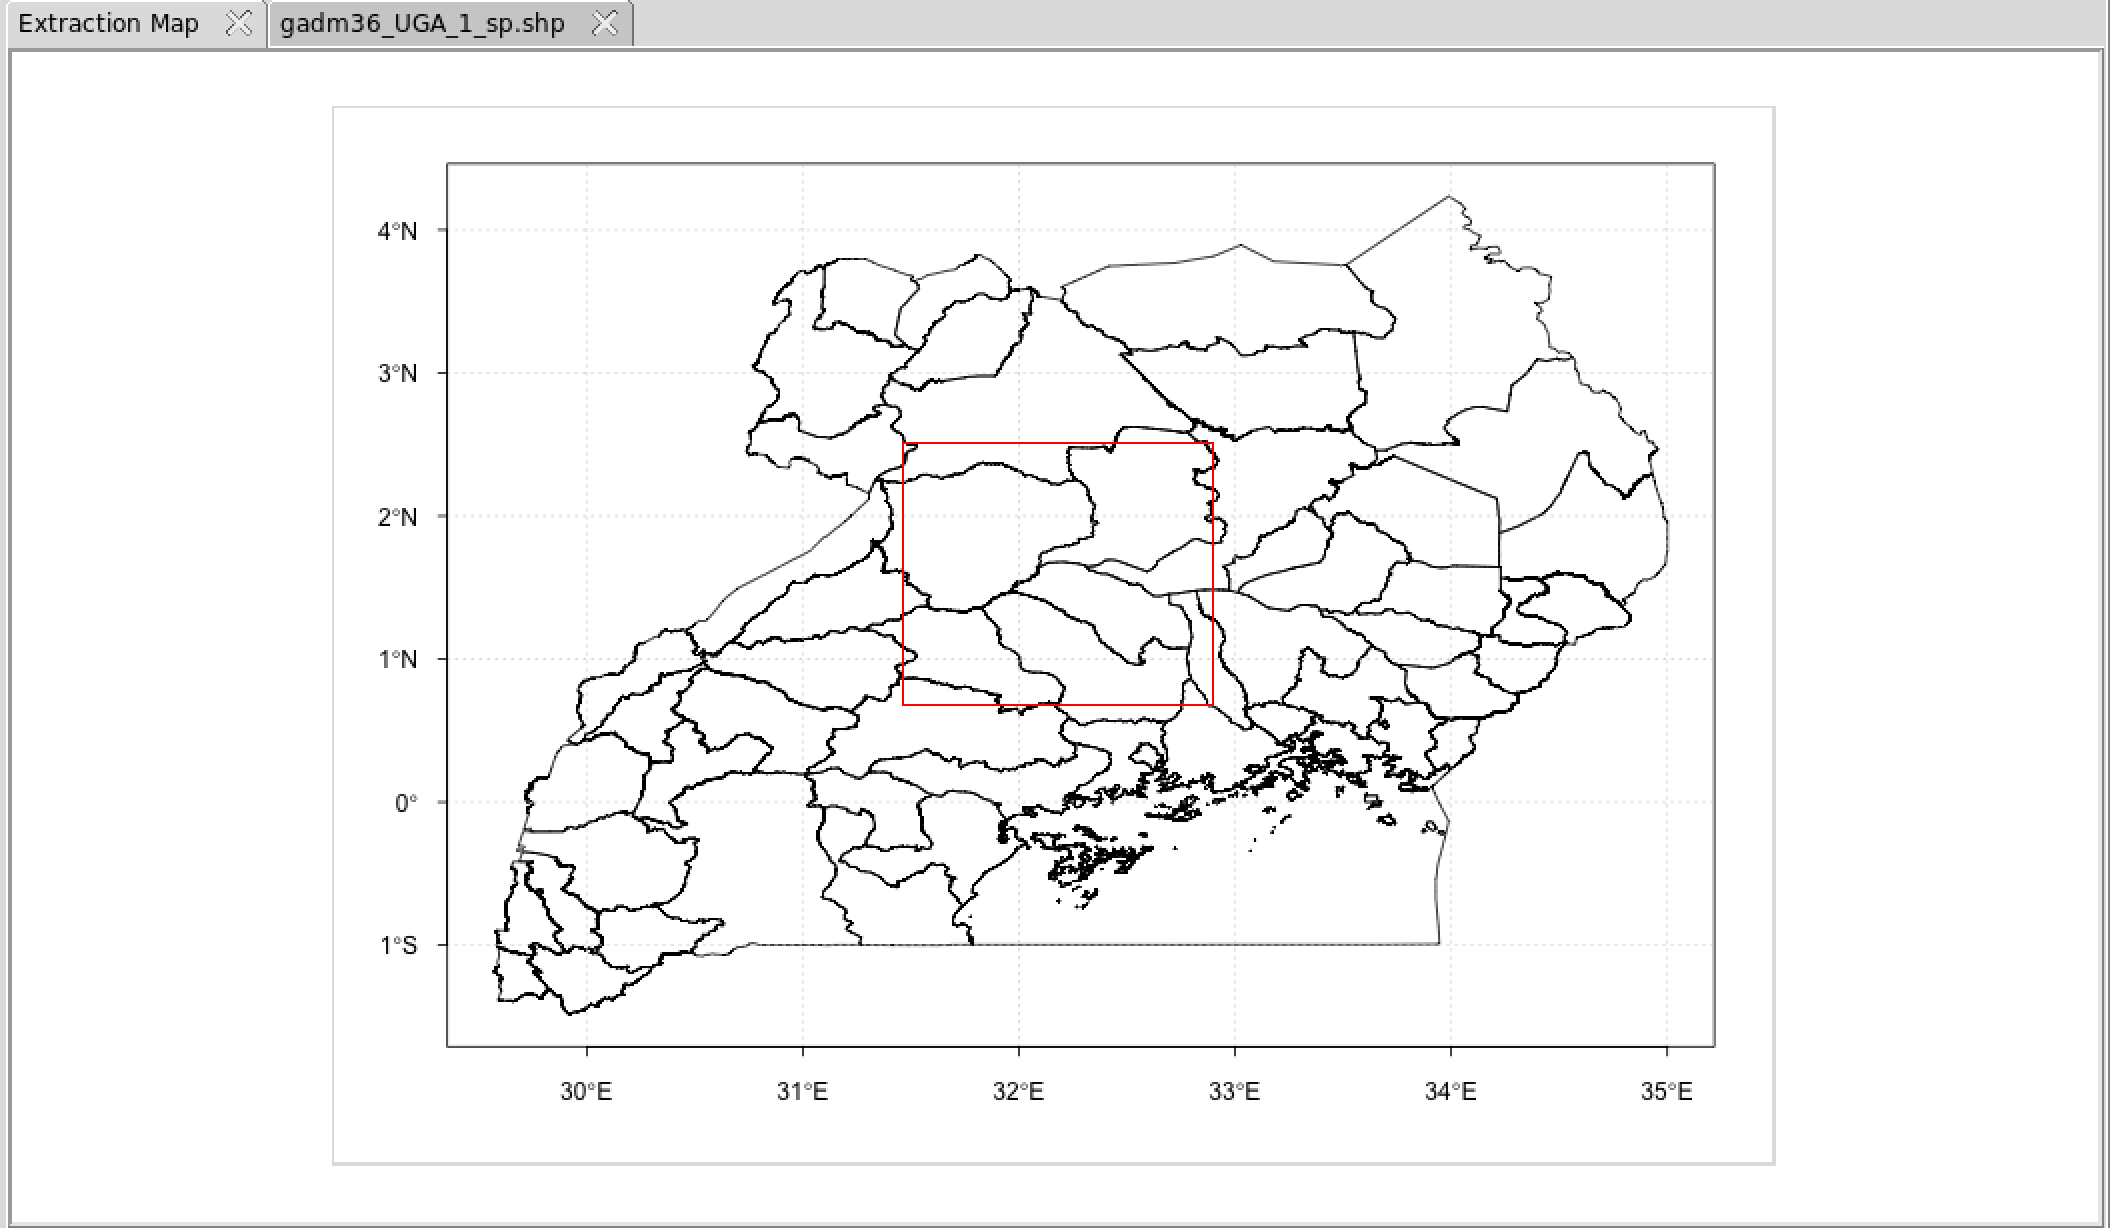
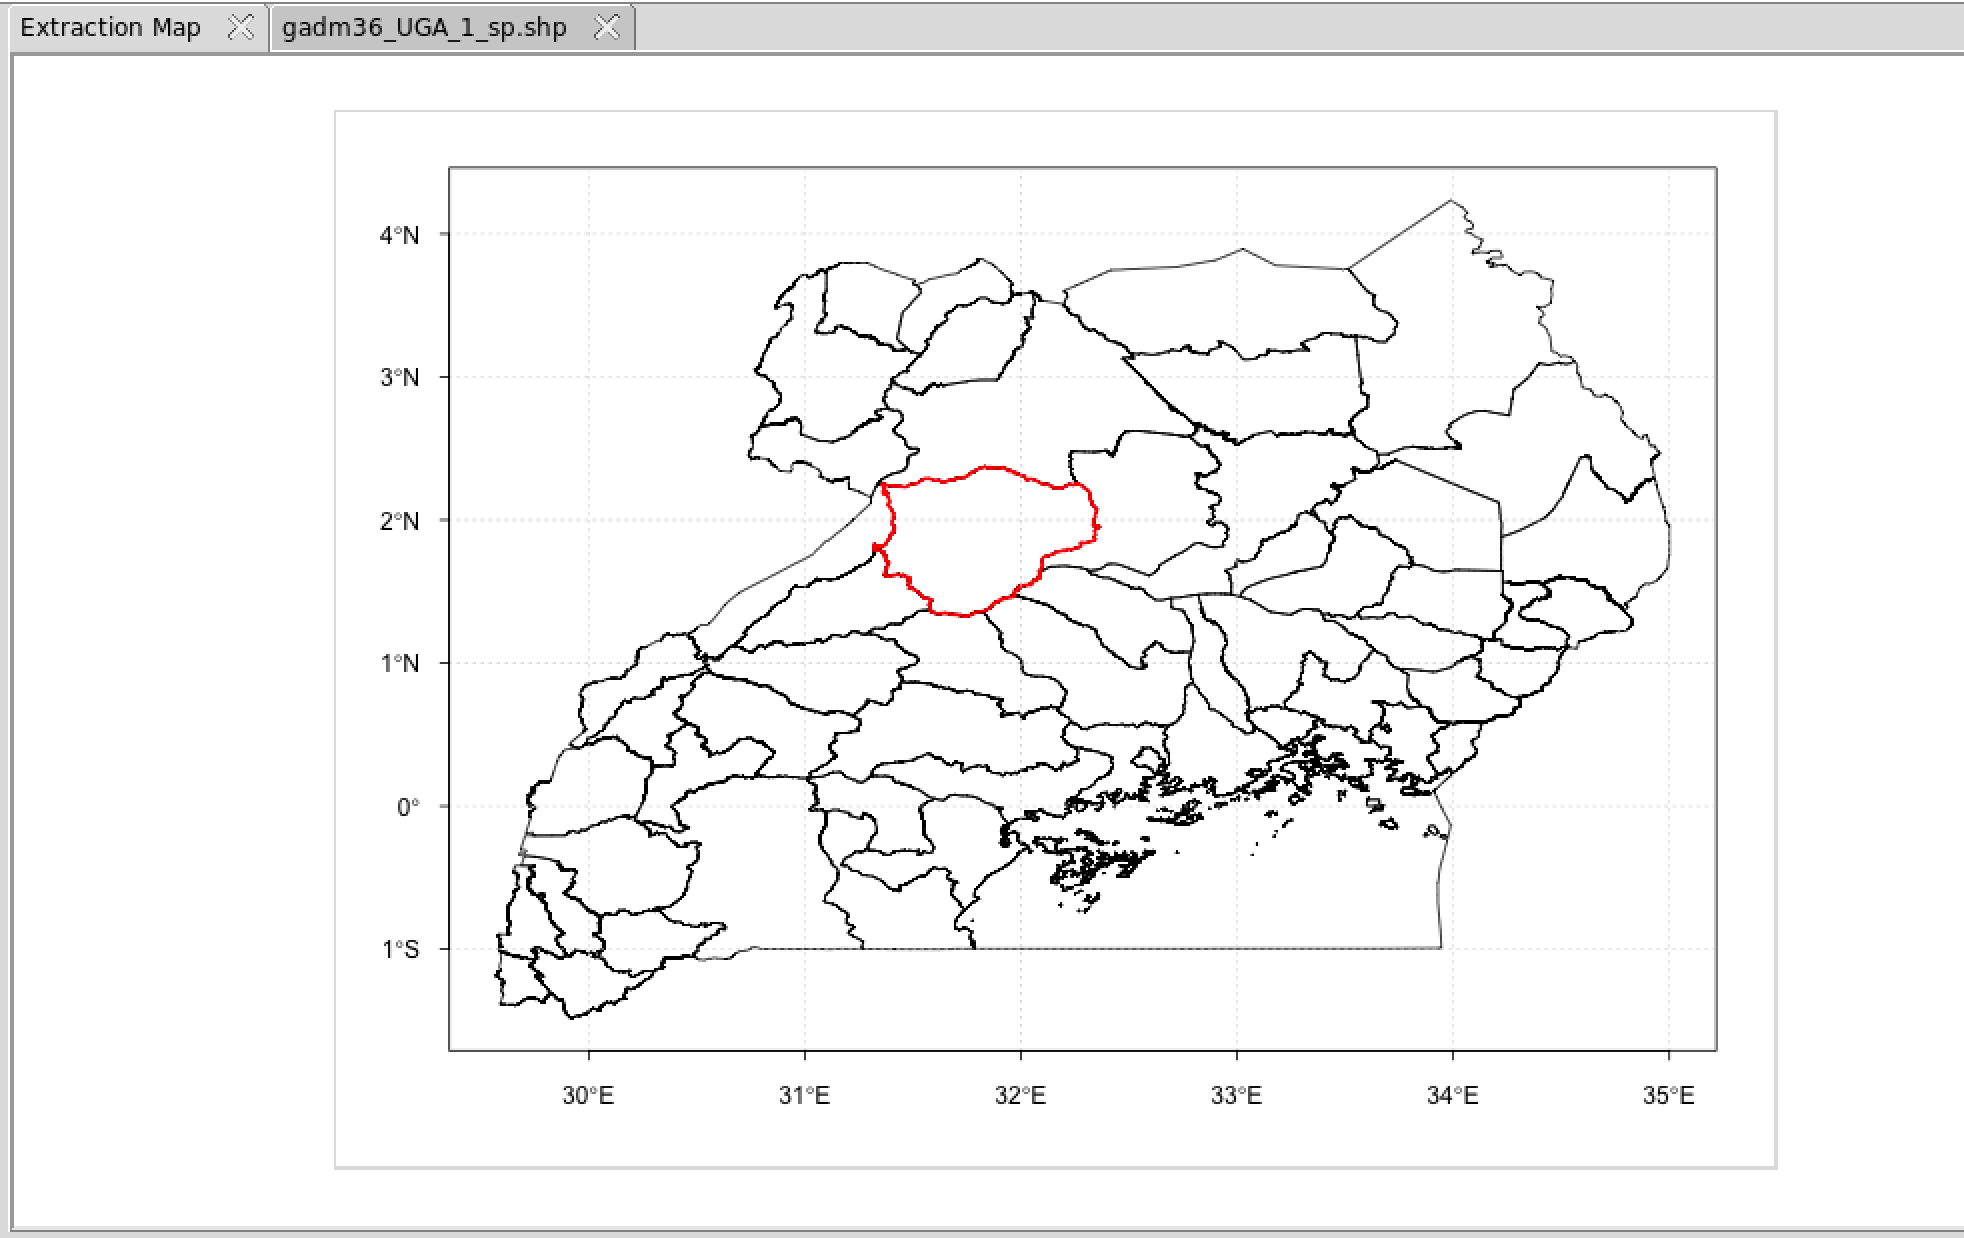
Click to display the map on the right panel. When you move the cursor over the map, the longitude, latitude and the name of the polygon (depending on the attribute field selected in 6) at the cursor position will be displayed on the status bar.
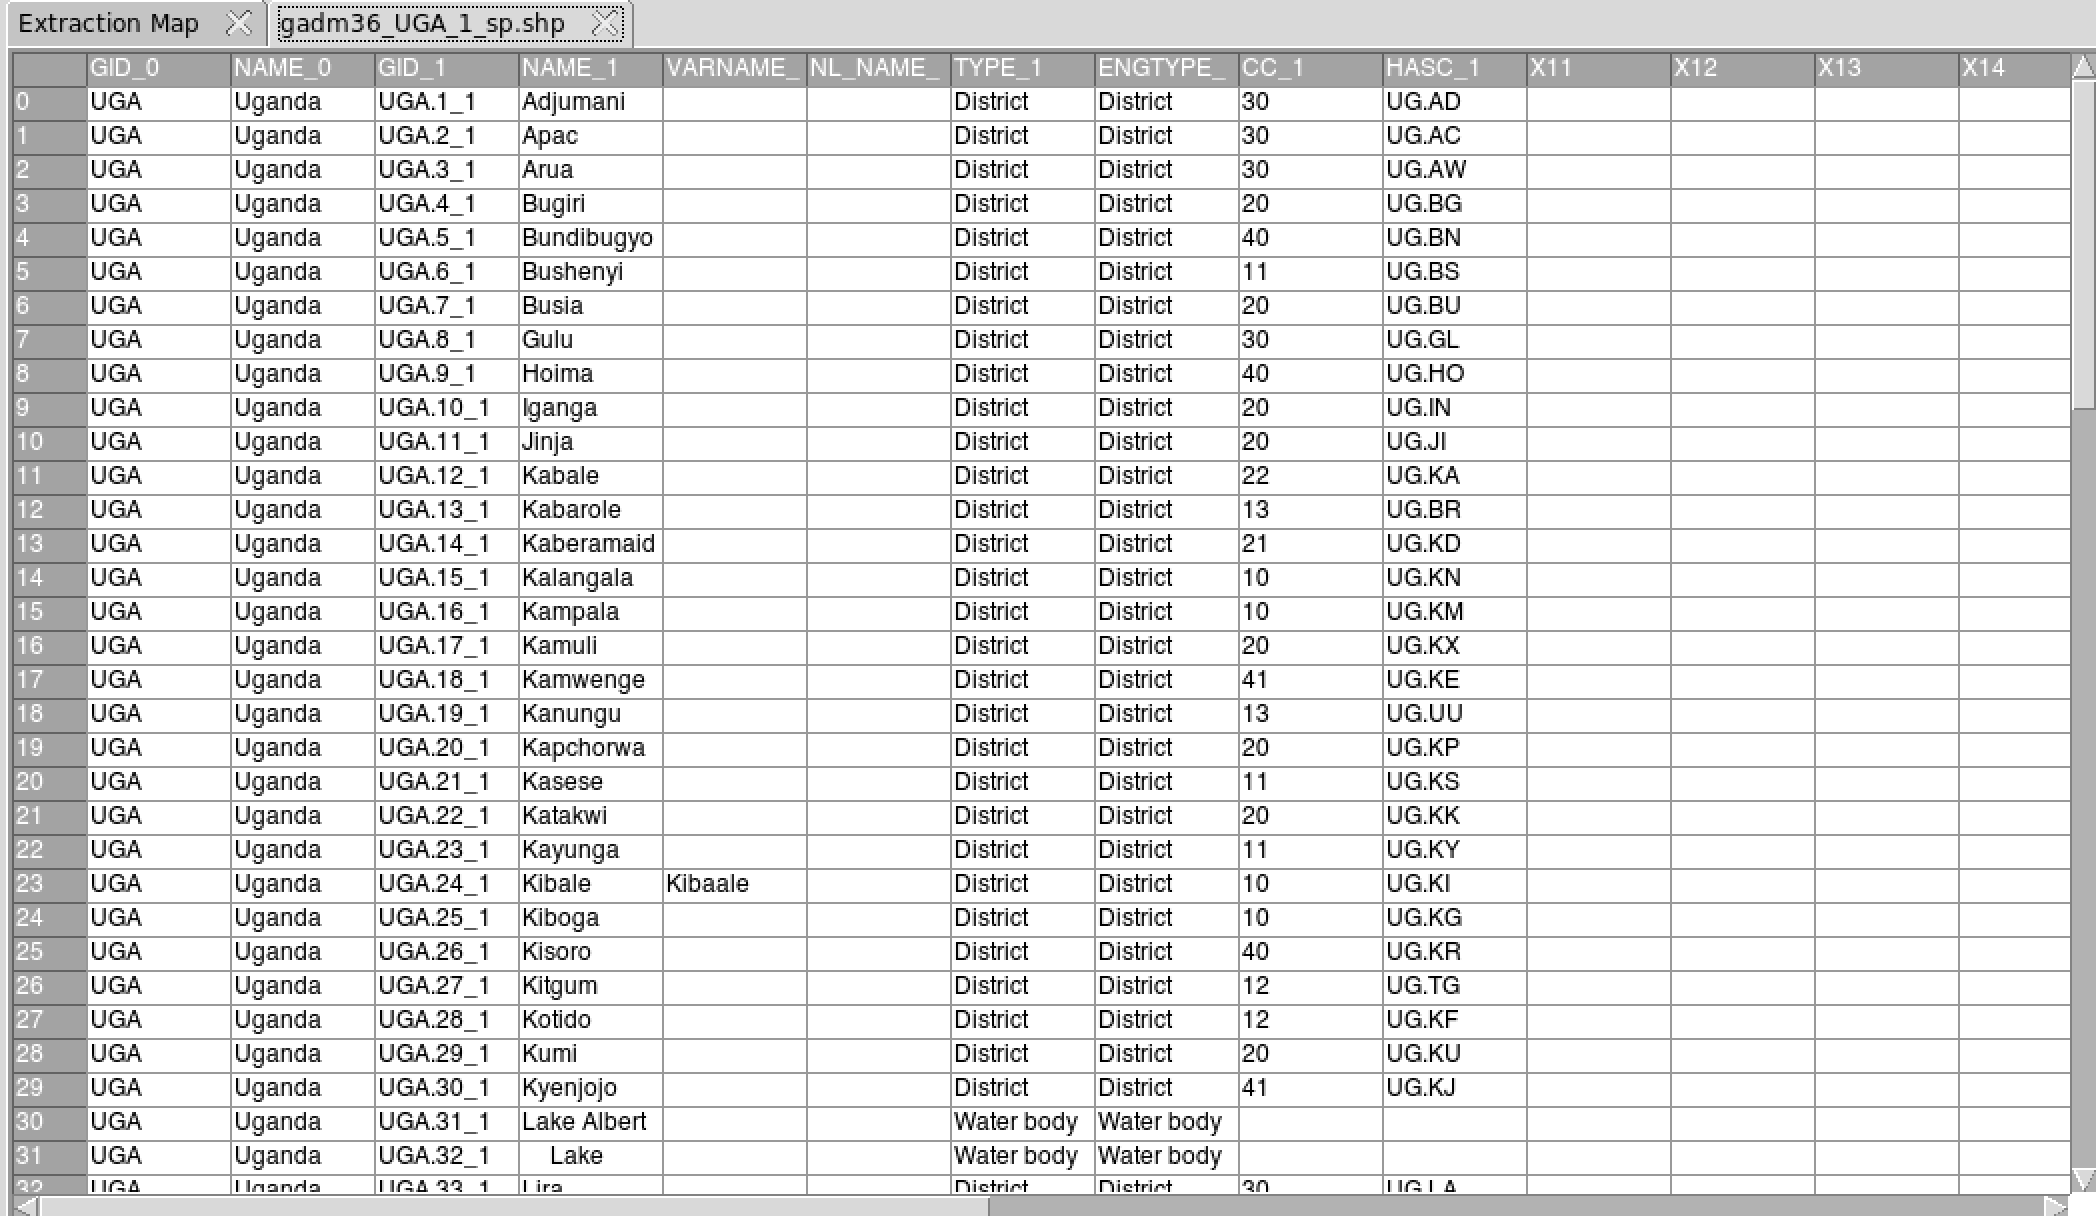
Click to display a table of the attributes continaing inside the shapefile on the right panel.
The tab Locations allows to specify the support on which the data will be extracted.
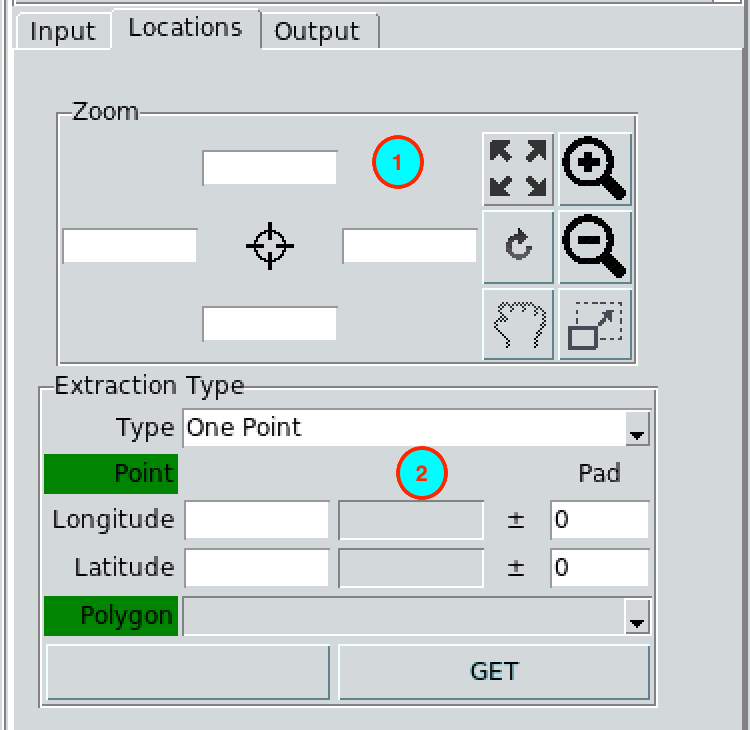
If a map is displayed, you can use these buttons to zoom in and out, or to specify the region to be displayed by entering its bounding box in the entry fields. Right click on the map to deactivate the zoom’s button.
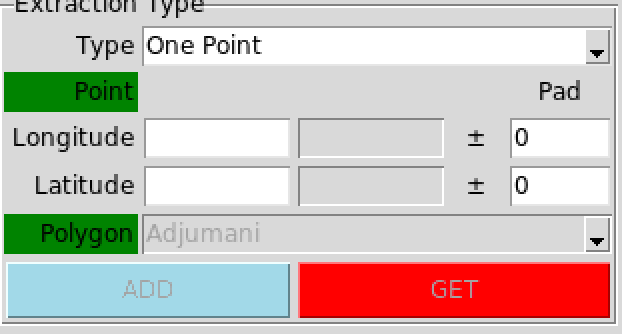
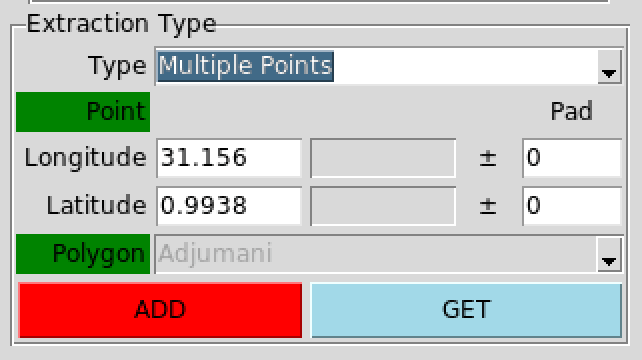
Select the support on which you want to extract the data. Valid options are: One Point, Multiple Points, Rectangle, One Polygon and Multiple Polygons.
- One Point: allows to extract data on a single point.
To get the location you want to extract the data, you can enter the longitude and latitude of this location (when using this method, you do not need to provide a shapefile and display the map), or if a map is displayed, you can click on the button when it turns red click on the map to get the point.
Instead of extracting the data on the exact grid, you can perform a spatial average over the grid surrounding the target grid by setting the Pad entries. For example, if you want to extract a spatial average of the data over all grids located within a distance 0.1 degree on the longitude and 0.2 degree on the latitude from the coordinates you provided, enter 0.1 on the column Pad corresponding to the longitude and 0.2 for latitude.
- Multiple Points: allows to extract data over a multiple locations.
It will display the dialog box below.
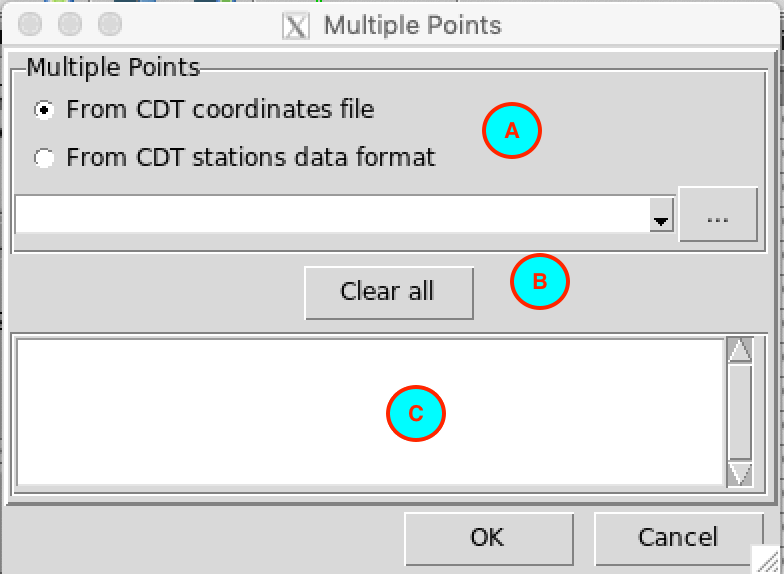
- (A) Input file to use to get the coordinates of the locations to be extracted, see below for more details. If you use this option, you do not need to provide a shapefile and display the map.
- (B) Click this button to reset all selected locations.
- (C) All selected locations will be displayed here.
There are several ways to extract the data over a multiple points.
- You can enter the longitude and latitude of one location then click on to add the point on the list in (C).
- You can click on the button and when it turns red click on the map to get the point, when turns red click on it to add the selected point on the list in (C).
- You can get the coordinates of the locations from a CDT coordinates file.
Select
 CDT coordinates file on
(A) then select the file from the drop-down list if it
is already loaded, or open it from the browse button on the right. All the locations
will be displayed in (C).
CDT coordinates file on
(A) then select the file from the drop-down list if it
is already loaded, or open it from the browse button on the right. All the locations
will be displayed in (C). - You can get the coordinates of the locations from a CDT stations data format
file. Select
CDT stations data format on
(A) then select the file from the drop-down list if it
is already loaded, or open it from the browse button on the right. All the locations
will be displayed in (C).
The same as a single point, you can spatially average the data over the grid surrounding each location by providing the Pad.
If you got all the locations you want click .
- Rectangle: allows to extract data over a selected rectangular area.
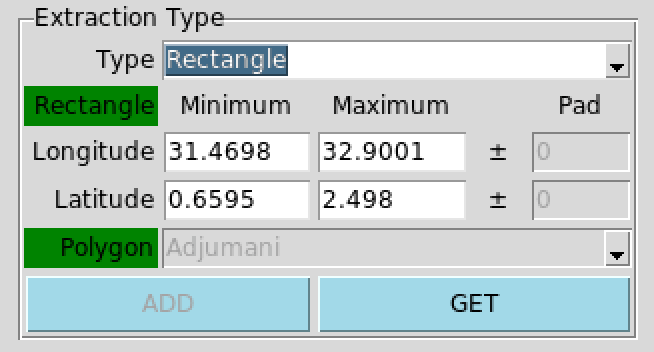
To select the area you want to extract the data, you can do as follow
- specify the bounding box of the rectangle by entering the minimum and maximum longitude and latitude (when using this method, you do not need to provide a shapefile and display the map),
- click on the button when it turns red drag the cursor on the map to get the desired rectangle.
- One Polygon: allows to extract data over a selected polygon.
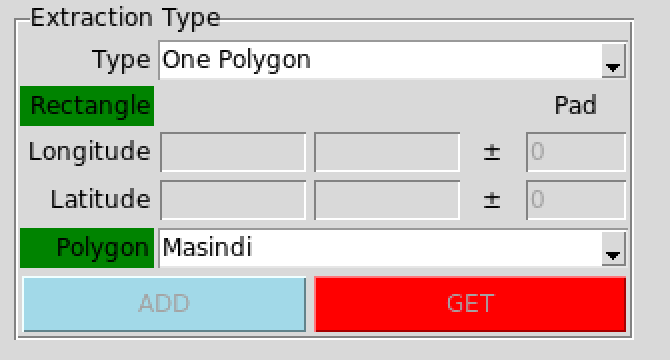
To select the polygon you want to extract the data, you can do as follow
- select the name of the polygon from the drop-down list, the name listed here is corresponding to the attribute field you have selected from the tab Input number (6),
- click on the button when it turns click on the map to select the desired polygon.
- Multiple Polygons: allows to extract data over a multiple polygons.
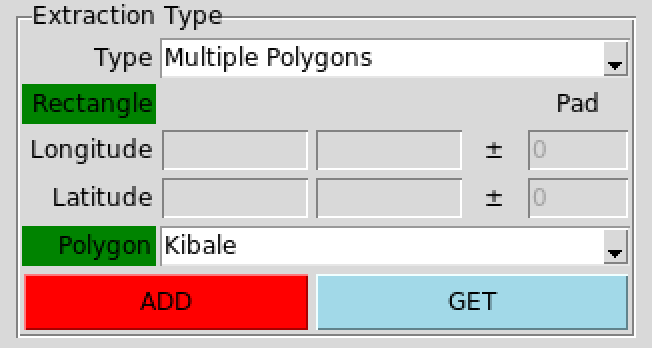
The name of the polygons listed in the drop-down list are from the attribute field you have selected from the tab Input number (6).
It will display the dialog box below.
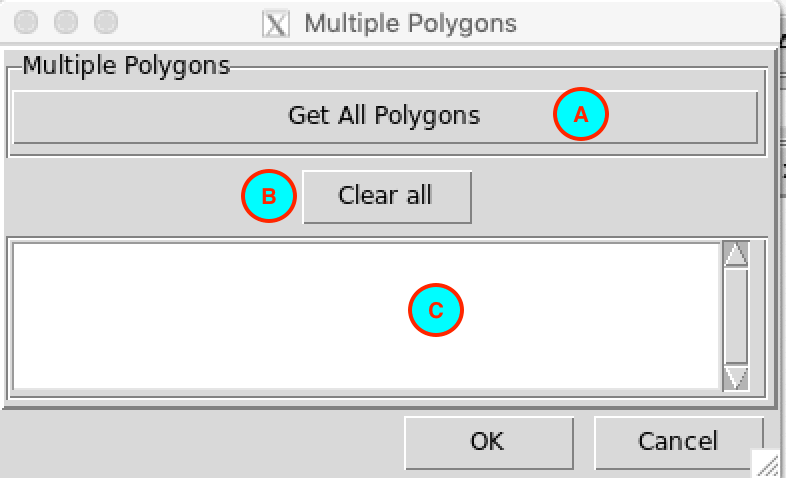
- (A) Button to get all the polygons from the shapefile, see below for more details.
- (B) Click this button to reset all selected polygons.
- (C) All selected polygons will be displayed here.
There are three ways to extract the data over a multiple polygons.
- You can select the name of the polygon from the drop-down list then click on to add it on the list in (C).
- You can click on the button and when it turns red click on the map to select the desired polygon, when turns red click on it to add the selected polygon on the list in (C).
- You can get the all the polygons from the shapefile by clicking the button on (A). The name of the polygons will be displayed in (C).
If you got all the polygons you want click .
The tab Output allows to specify the date range, the format of the extracted data.
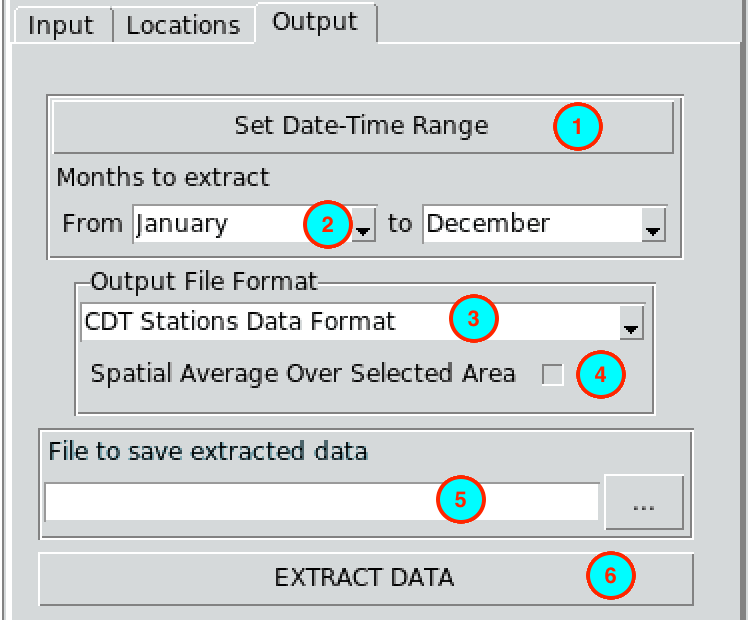
Set the date and time range of the data to extract. See Setting date range for more details.
Select the start and end month you want to extract.
Select the format of the extracted data. Available data formats are: CDT Stations Data Format, CPT File Format, NetCDF Files and Time|Lat|Lon|Value Format.
The formats listed here depend on the extraction support you have selected from the tab Locations .
The Time|Lat|Lon|Value Format format is a format of data with 4 columns, the 1st column is for the date or time, the 2nd column the latitude, the 3rd column the longitude, and the 4th column contains the value of the extracted data.When activated, check the box if you want to perform a spatial average of the data over the selected area or polygon. If this option is deactivated and the box is checked, this means that the data is spatially averaged over the selected area or polygon. If the box is unchecked, you will get a gridded data.
Specify the folder or the name of the file (depend on the data output format) to save the extracted data by browsing it from the button
or typing the full path to the
folder or the file.Click on to start the extraction.