Visualizing, Analyzing and Downloading Sub-seasonal to Seasonal (S2S) Data with the IRI Data Library: A Swiss-Army-Knife for S2S Data
By Andrew W. Robertson, Ángel G. Muñoz, Michael Bell
This article originally appeared in the newsletter [PDF] of the S2S Prediction Project, of which Robertson serves as co-chair.
The International Research Institute for Climate and Society Data Library (IRIDL) is a powerful and freely accessible online data repository and analysis web-service that allows a user to view, analyze, and download hundreds of terabytes of climate-related data through a standard web browser in a computer or a smartphone. A wide variety of operations, from simple anomaly calculations to more complex EOF or cluster analyses can be performed with just a few clicks.
About 75% of the S2S Database forecasts and reforecasts, including all models’ RMM indices for Madden-Julian Oscillation (MJO) analysis, are presently available in the IRIDL from the ECMWF server and kept up to date as new forecasts & reforecasts are made. It provides a flexible and fully online interface to the S2S database, for easy subsetting, analysis & visualization, and download in a variety of formats, including NetCDF, GoogleEarth’s KML and GIS- compatible layers. Furthermore, the IRIDL is an OpenDAP server, which means local client programs –e.g., written in Python, R or Matlab– can read the desired data online, avoiding the need to download it explicitly, saving disk space and increasing efficiency.
These features make the S2S data more accessible to a much broader community of researchers in both climate science, forecasting, and societal applications research & development, including sectors such as agriculture, water resource management, disaster risk reduction, public health and energy.
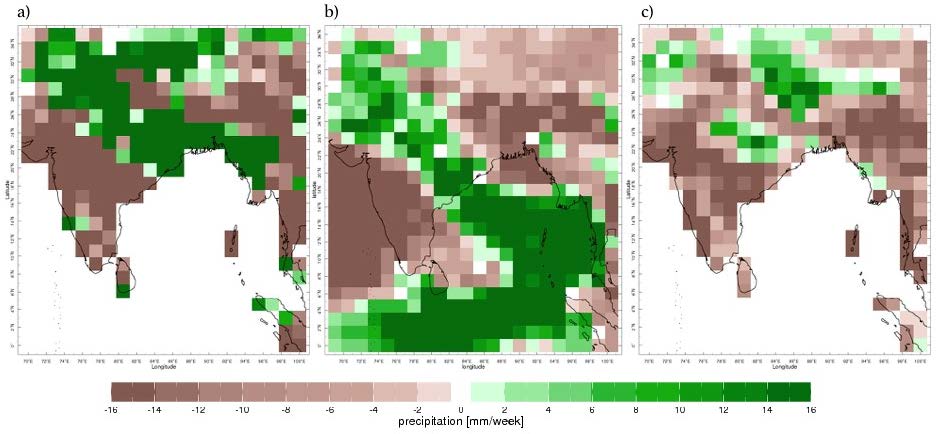
Figure 1. Weekly precipitation anomalies for (a) CHIRPS observed data, Jul 6-12, 2015, (b) ECMWF ensemble mean week-3 forecast from Jun 22, and (c) CHIRPS anomalies composited for July over MJO Phase 8.
The IRIDL contains a large number of observational and reanalysis datasets that can be easily used in conjunction with the S2S model data for forecast verification, calibration and forecast tailoring studies. It also archives the NOAA SubX project data. Having both S2S and SubX in the same platform is a big bonus for researchers.
Downloading S2S Data has never been easier: data can be subsetted and post-processed (such as ensemble or weekly averaging) prior to download, potentially reducing the required bandwidth. A GUI interface provides interactive data selection, filters (e.g. averaging), views and download, while the Ingrid scripting language provides full control. Several examples are shown below. Individual post-processed data can be downloaded interactively through log in to the IRIDL authorization service (and one-time sign-off on the S2S data Terms & Conditions from ECMWF), or from the unix command line via curl (and similar programs) and a security access key. Details on how to use curl directly in the command line, or how to have it working in different coding languages can be found in the IRI Wiki site.
Example: A monsoon break over India during July 2015
Figure 1a shows the weekly rainfall anomaly July 6-12, 2015, constructed from CHIRPS daily 0.25-deg rainfall data. Anomalously dry conditions were present over peninsular India, with anomalously heavy rainfall to the northeast over the Indogangetic plain and Himalayan foothills, forming a dipolar pattern characteristic of the Boreal summer intraseasonal oscillation (BSISO), aka the summertime MJO. The Ingrid script used to make this map is shown in Fig. 2a. The GRID function regrids the 0.25-deg data to 1.5-deg for comparison with S2S data. Apentad climatology is then loaded, regridded linearly in time to daily and then subtracted from the CHIRPS, before summing over the July 6-12 range; units are converted to mm/week.
The ECMWF ensemble-mean forecast anomaly for July 6-12, initialized on June 22 (“week 3”), is shown in Fig. 1b. The forecast captures the basic anomaly dipole with anomalously dry conditions over the peninsula and wet anomalies to the northeast, though with a slight location shift. This plot was made using the script in Fig. 2b, where the start S on June 22 was selected, and the difference of the accumulated precipitation between lead times 21 and 14 days is computed, taking the [M] average over all ensemble members. The second part of the script does the same for the reforecasts, and averages over all hdate years to subtract the model’s lead-dependent climatology.
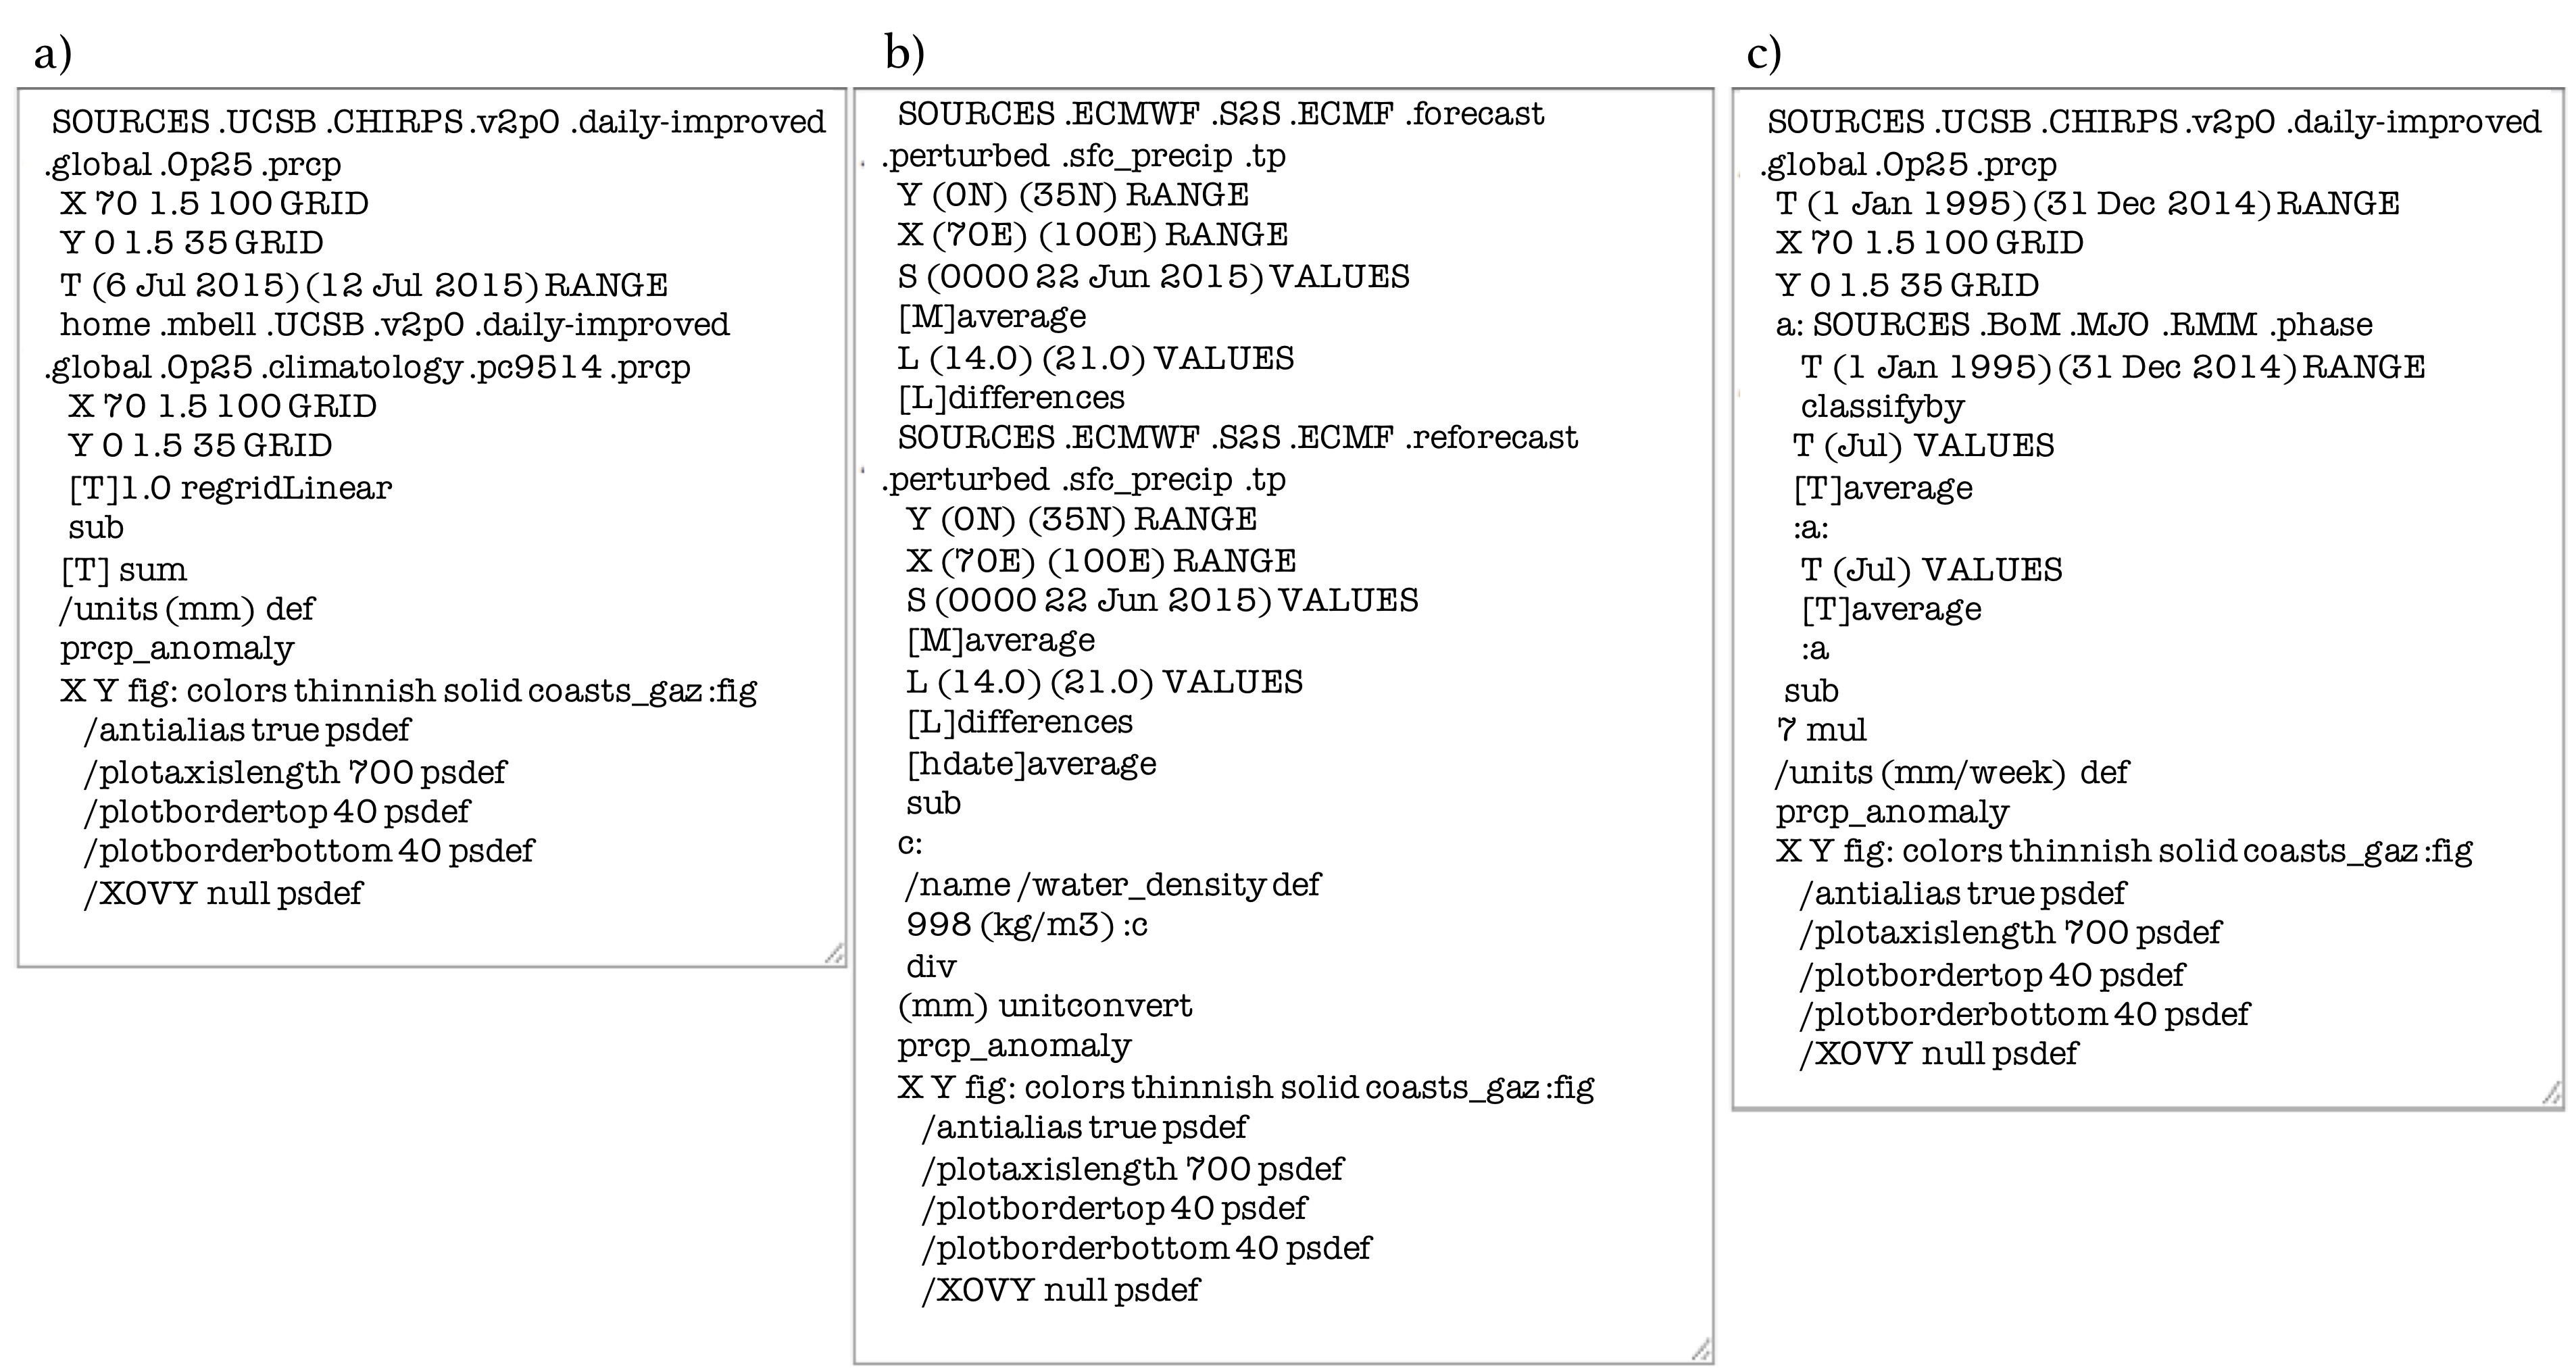
Figure 2. Ingrid code used to create the maps in Fig. 1. Click on the following links to obtain the respective URLs: (a), (b), (c).
The model’s quite good skill at week 3 suggests that the intraseasonal oscillation is a source of predictability, and indeed the MJO was transitioning from Phase 7 to 8 during the July 6-12 period (details here). This can be approximately assessed by constructing MJO phase composites. Figure 1c shows CHIRPS anomaly rainfall composited for Phase 8, which indeed shows monsoon break conditions over peninsular India and some anomalously high rainfall to the northeast.
The Ingrid script (Fig. 2c) first loads and regrids the CHIRPS data. It then loads the RMM index phase time series produced by BoM which it uses to classify the CHIRPS, select all Julys 1995-2005, average for each phase, and lastly subtract the July climatology.
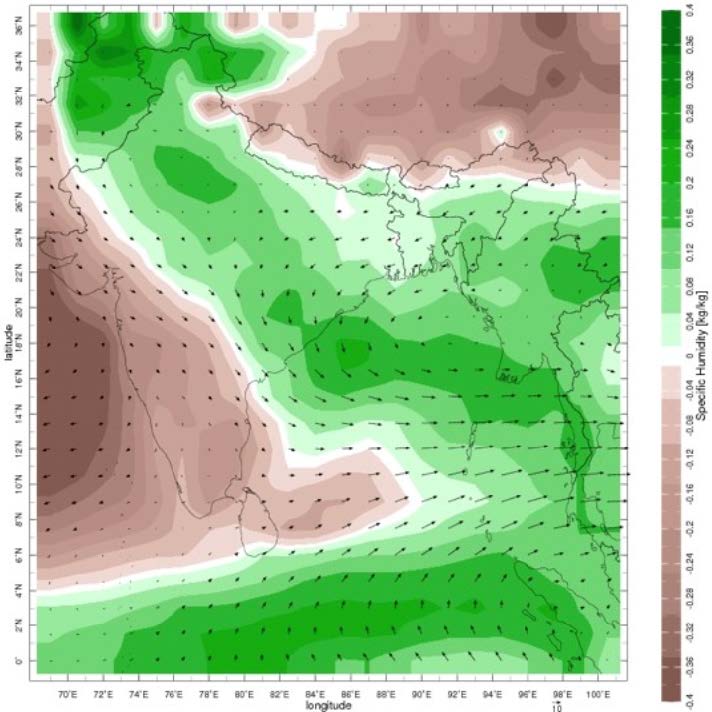
Figure 3. ECMWF week-3 forecast anomalies of vertically integrated moisture flux (vectors) and vertically integrated specific humidity (colors). Details as Fig. 1b. IRIDL link. (Since the calculations in the Data Library are performed in real time, the figure may take some time to appear.)
The above example just scratches the surface of the IRIDL’s capabilities. Figure 3 shows week 3 ECMWF forecast anomalies of a more complex field computed in IRIDL: the vertically integrated moisture flux (vectors), with the vertically integrated specific humidity anomalies shown in colors. The latter closely mirrors the forecast precipitation anomalies in Fig. 2b, while the moisture flux anomalies show a southeastward flux coincident with the zone of anomalous moisture.
All figures, Ingrid scripts and datasetsprocessed by the user can be easily reproduced online by simply sharing the corresponding URL; and the figures and associated data can be easily downloaded in a variety of formats, or dynamically added as a widget to, for example, a project website. The reader is invited to click on the links in the figure captions, which contains the Ingrid codes used to make the figures, and to visit the IRI Wiki site for further examples.
For any inquiries, please send an email to our Help Desk (help@iri.columbia.edu).
Acknowledgement
Archiving of the S2S Database in the IRI Data Library was made possible through support from NOAA and IRI.
You must be logged in to post a comment.