IRI ENSO Forecast
IRI Technical ENSO Update
Published: May 19, 2020
Note: The SST anomalies cited below refer to the OISSTv2 SST data set, and not ERSSTv4. OISSTv2 is often used for real-time analysis and model initialization, while ERSSTv4 is used for retrospective official ENSO diagnosis because it is more homogeneous over time, allowing for more accurate comparisons among ENSO events that are years apart. During ENSO events, OISSTv2 often shows stronger anomalies than ERSSTv4, and during very strong events the two datasets may differ by as much as 0.5 C. Additionally, the ERSSTv4 may tend to be cooler than OISSTv2, because ERSSTv4 is expressed relative to a base period that is updated every 5 years, while the base period of OISSTv2 is updated every 10 years and so, half of the time, is based on a slightly older period and does not account as much for the slow warming trend in the tropical Pacific SST.
Recent and Current Conditions
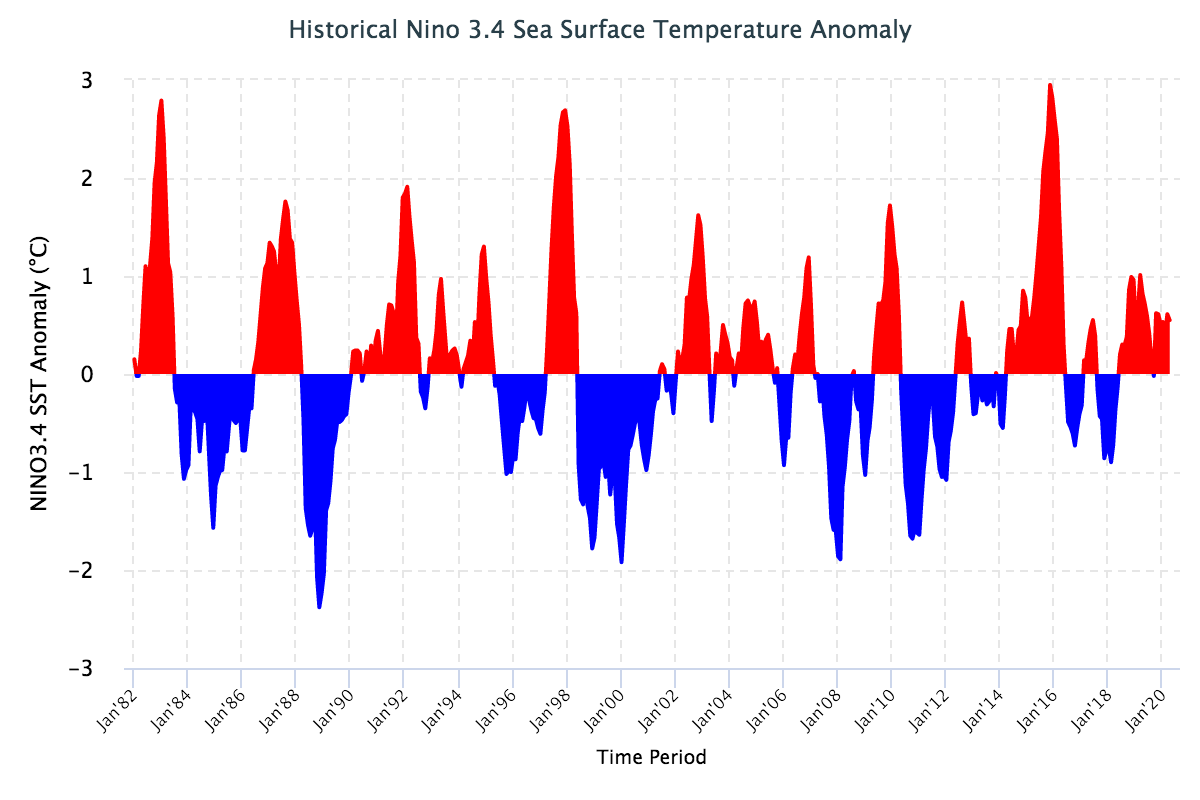
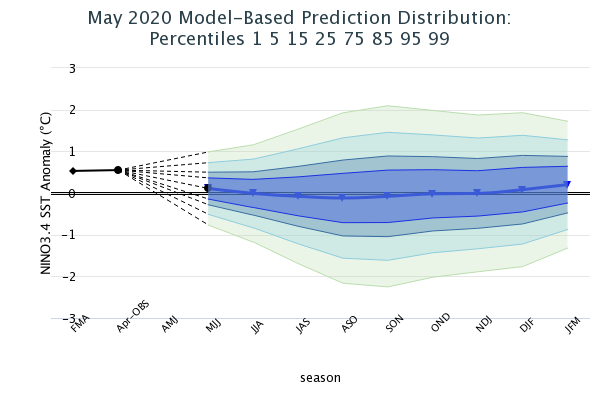
In mid-May 2020, SSTs had decreased from above average to near average in the NINO3.4 region. The April SST anomaly was 0.55 C, near the bottom of the weak El Niño range, and for Feb-Apr it was 0.53 C, also in the weak El Niño range. The IRI’s definition of El Niño, like NOAA/Climate Prediction Center’s, requires that the SST anomaly in the NINO3.4 region (5S-5N; 170W-120W) exceed 0.5 C. Similarly, for La Niña, the anomaly must be -0.5 C or less. The climatological probabilities for La Niña, neutral, and El Niño conditions vary seasonally, and are shown in a table at the bottom of this page for each 3-month season. The most recent weekly anomaly in the NINO3.4 region was -0.3 C, in the lower half of the ENSO-neutral range. SSTs are becoming slightly below average in the east-central and the eastern equatorial Pacific, and are near to somewhat above average in the west-central Pacific. Many of the key atmospheric variables such as the low-level and upper-level zonal wind anomalies, the Southern Oscillation Index and patterns of cloudiness and rainfall, have been exhibiting neutral ENSO conditions or most lately leaning slightly toward coolish conditions. Subsurface temperature anomalies from the dateline eastward in the equatorial Pacific have lately become below-average as a layer of below-average water at depth has expanded to partly encompass the surface. Overall conditions, then, currently lean slighty more toward La Niña than El Niño, but still suggest an ENSO-neutral state.
Expected Conditions
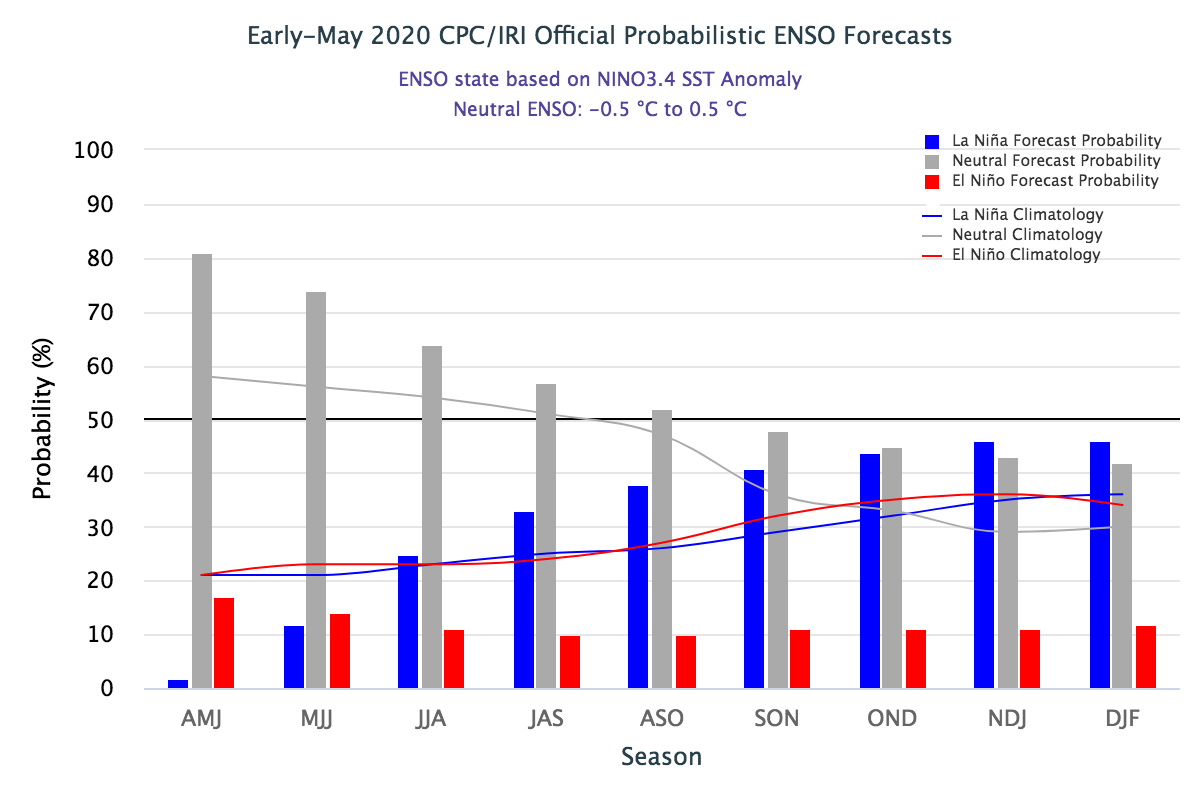
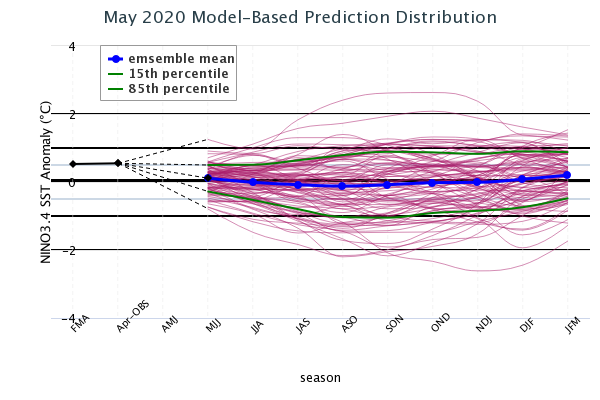
What is the outlook for the ENSO status going forward? The most recent official diagnosis and outlook was issued approximately one week ago in the NOAA/Climate Prediction Center ENSO Diagnostic Discussion, produced jointly by CPC and IRI; it states that neutral conditions are most likely to continue through the summer and fall, with La Niña being more likely than El Niño during the second half of the year. The latest set of model ENSO predictions from mid-May, now available in the IRI/CPC ENSO prediction plume, is next discussed: As of mid-May only 12% of the dynamical or statistical models predicts El Niño conditions for the May-Jul season, while 88% predicts ENSO-neutral. Going forward, the percentage of models predicting neutral gradually drops, reaching 70% by Sep-Nov and 50% by Jan-Mar 2021. Percentages of models predicting La Niña are near-zero for May-Jul, rise to 20% for Jul-Sep and Aug-Oct, and then fall just slightly for the longer-lead seasons. Chances for El Niño are only 12 to 15% from May-Jul through Nov-Jan, and then rise somewhat, reaching nearly 40% for Jan-Mar.
Note – Only models that produce a new ENSO prediction every month are included in the above statement.
Caution is advised in interpreting the distribution of model predictions as the actual probabilities. At longer leads, the skill of the models degrades, and skill uncertainty must be convolved with the uncertainties from initial conditions and differing model physics, leading to more climatological probabilities in the long-lead ENSO Outlook than might be suggested by the suite of models. Furthermore, the expected skill of one model versus another has not been established using uniform validation procedures, which may cause a difference in the true probability distribution from that taken verbatim from the raw model predictions.
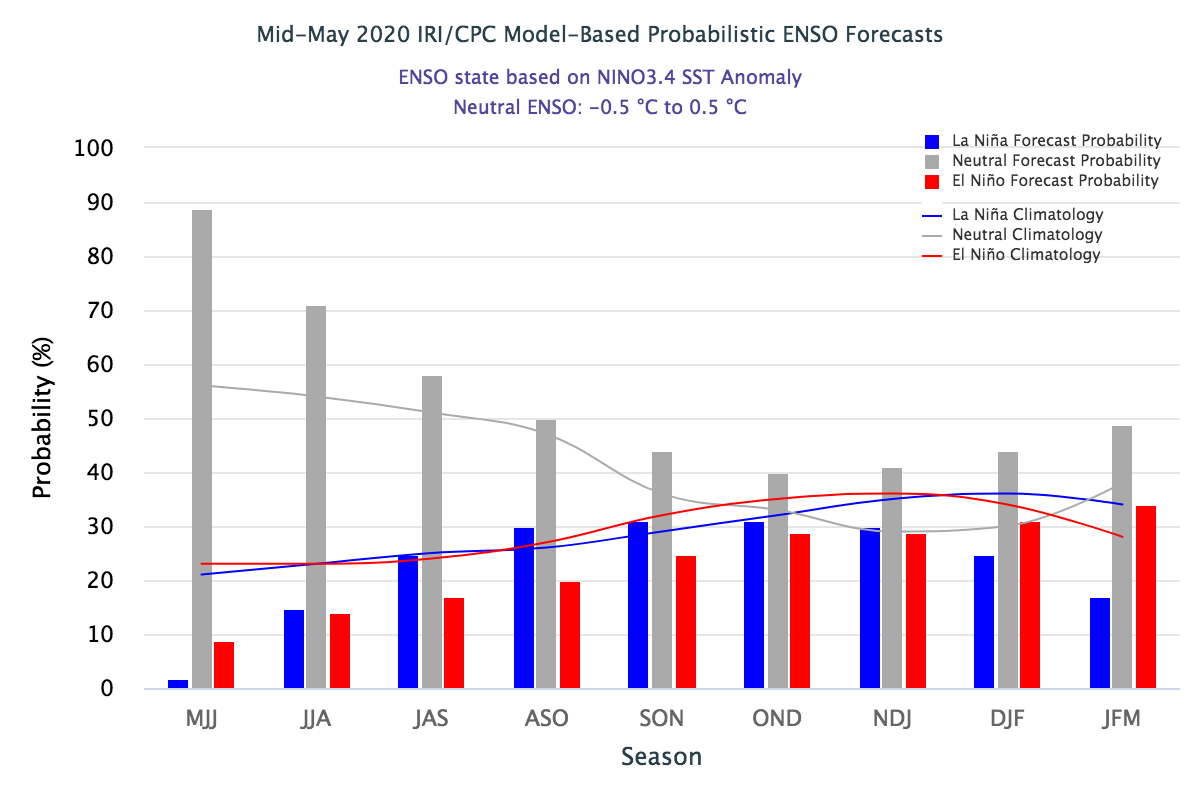
An alternative way to assess the probabilities of the three possible ENSO conditions is more quantitatively precise and less vulnerable to sampling errors than the categorical tallying method used above. This alternative method uses the mean of the predictions of all models on the plume, equally weighted, and constructs a standard error function centered on that mean. The standard error is Gaussian in shape, and has its width determined by an estimate of overall expected model skill for the season of the year and the lead time. Higher skill results in a relatively narrower error distribution, while low skill results in an error distribution with width approaching that of the historical observed distribution. Using this method, chances for El Niño are 9% for the May-Jul season, and chances for ENSO-neutral are 89%, leaving 2% for La Niña. Going forward, probabilities for neutral are higher than those for El Niño or La Niña for all seasons through the final season of Jan-Mar 2021. Probabilities for neutral are 71% for Jun-Aug, thereafter decreasing and settling to the 40-49% range from Sep-Nov through Jan-Mar. El Niño probabilities rise to near 20% for Aug-Oct, to about 30% for Oct-Dec through Dec-Feb, and to 34% for Jan-Mar. Chances for La Niña are below 20% through Jun-Aug, rise to about 30% for Aug-Oct through Nov-Jan, and then decrease to below 20% for the final season of Jan-Mar. A plot of the probabilities generated from this most recent IRI/CPC ENSO prediction plume using the multi-model mean and the Gaussian standard error method summarizes the model consensus out to about 10 months into the future.
The same cautions mentioned above for the distributional count of model predictions apply to this Gaussian standard error method of inferring probabilities, due to differing model biases and skills. In particular, this approach considers only the mean of the predictions, and not the total range across the models, nor the ensemble range within individual models.
In summary, the probabilities derived from the models on the IRI/CPC plume describe, on average, a preference for neutral ENSO conditions relative to El Niño or La Niña for all forecast seasons. La Niña becomes more likely than El Niño from Jun-Aug through Nov-Jan. For Dec-Feb and Jan-Mar, however, El Niño again becomes slightly more likely than La Niña. A caution regarding this latest set of model-based ENSO plume predictions, is that factors such as known specific model biases and recent changes that the models may have missed will be taken into account in the next official outlook to be generated and issued early next month by CPC and IRI, which will include some human judgment in combination with the model guidance.
IRI/CPC Mid-Month Model-Based ENSO Forecast Probabilities
| Season |
La Niña |
Neutral |
El Niño |
| MJJ 2020 |
2% |
89% |
9% |
| JJA 2020 |
15% |
71% |
14% |
| JAS 2020 |
25% |
58% |
17% |
| ASO 2020 |
30% |
50% |
20% |
| SON 2020 |
31% |
44% |
25% |
| OND 2020 |
31% |
40% |
29% |
| NDJ 2020 |
30% |
41% |
29% |
| DJF 2020 |
25% |
44% |
31% |
| JFM 2020 |
17% |
49% |
34% |