IRI ENSO Forecast
IRI Technical ENSO Update
Published: April 19, 2024
Note: The SST anomalies cited below refer to the OISSTv2 SST data set, and not ERSSTv5. OISSTv2 is often used for real-time analysis and model initialization, while ERSSTv5 is used for retrospective official ENSO diagnosis because it is more homogeneous over time, allowing for more accurate comparisons among ENSO events that are years apart. These two products may differ, particularly during ENSO events. The difference between the two datasets may be as much as 0.5 °C. Additionally in some years, the ERSSTv5 may tend to be cooler than OISSTv2 in the context of warming trends, because ERSSTv5 is expressed relative to a base period that is updated every 5 years, while the base period of OISSTv2 is updated every 10 years. In February 2021, both datasets were updated to reflect the 1991-2020 climatology period.
Recent and Current Conditions
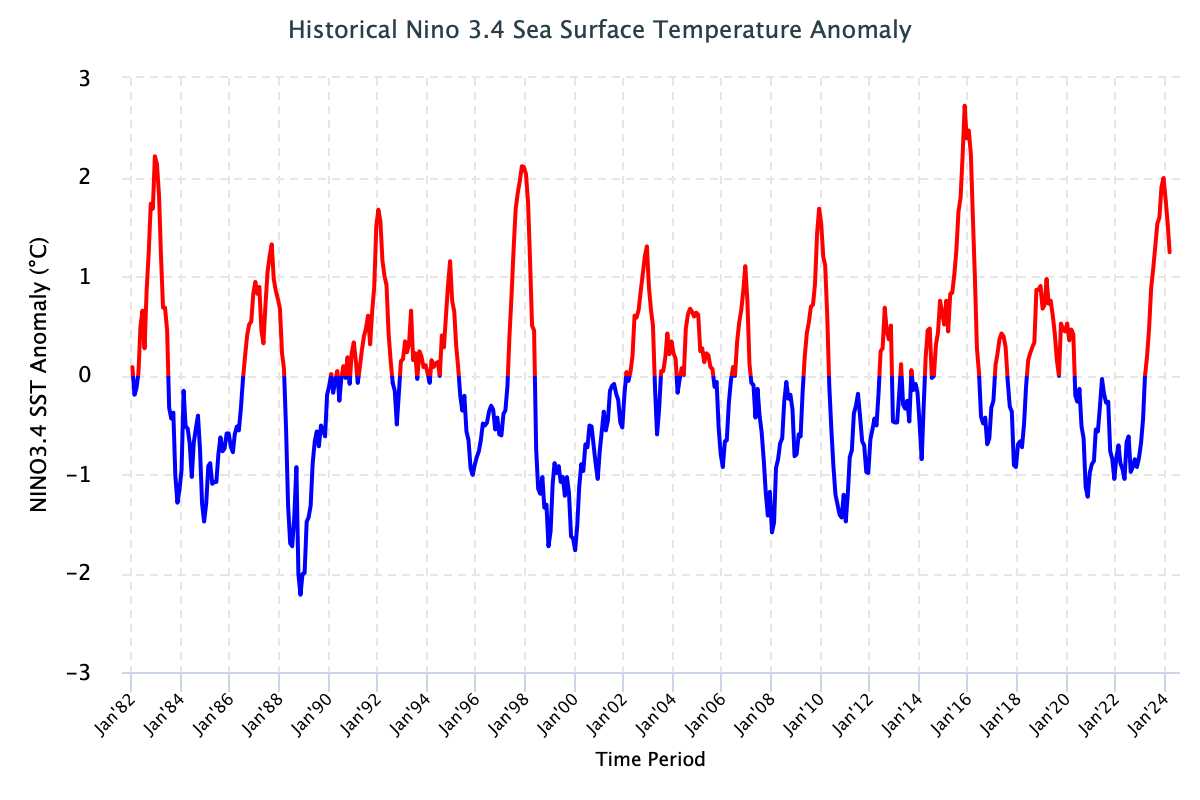
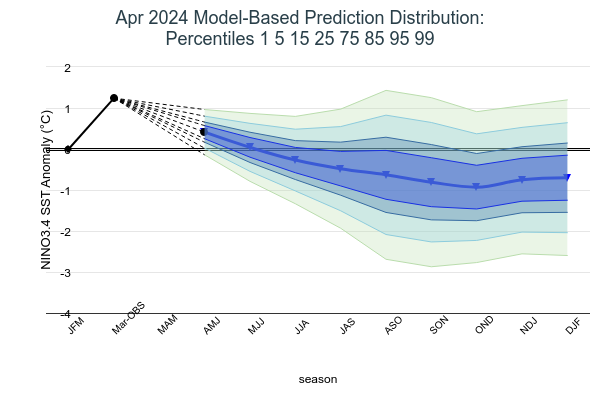
The SST anomaly for NINO3.4 during the Jan–Mar 2023 season was +1.52 °C, and for the month of March 2024 it was +1.24 °C. The most recent weekly (week centered on 10 April 2024) anomaly in the NINO3.4 region was +0.90 °C, indicating that the tropical Pacific is experiencing gradually weakening El Niño conditions. The IRI’s definition of El Niño, like NOAA/Climate Prediction Center’s, requires that the monthly SST anomaly in the NINO3.4 region (5S-5N; 170W-120W) exceed +0.5 °C. Similarly, for La Niña, the anomaly must be -0.5 °C or colder.
The oceanic and atmospheric conditions across the tropical Pacific indicate the continuation of an El Niño event, albeit with a diminishing intensity, reflected in both oceanic and atmospheric indicators. As of April 15, 2024, the 30-day Southern Oscillation Index stands within the ENSO-neutral range, with a value of -4.3, while the equatorial Southern Oscillation Index registers a value of –0.2 for the month of March 2024. The Trade winds (at 850 hPa) are mostly normal across most of the tropical Pacific, while the upper-level winds (at 200 hPa) are also close to average over the equatorial Pacific. In the equatorial Pacific Ocean, negative subsurface temperature anomalies have intensified and extended further westward across the Pacific Ocean, persisting both below 50 meters and near the surface east of 120 W. Meanwhile, warm subsurface temperature anomalies are prevalent (~ 1 °C), spanning from the central to eastern Pacific region from surface to 50 meters depth. These observed conditions in the coupled ocean-atmosphere system indicate a continuing El Niño state that is diminishing, and a possible future transition to La Niña.
Expected Conditions
Note – Only models that produce a new ENSO prediction every month are considered in this statement.
What is the outlook for the ENSO status going forward?
The El Niño/Southern Oscillation (ENSO) Diagnostic Discussion released on on 11 April 2024 by the Climate Prediction Center/NCEP/NWS released the El Niño advisory, and also issued a La Niña watch (60% chance) for Jun-Aug, 2024.
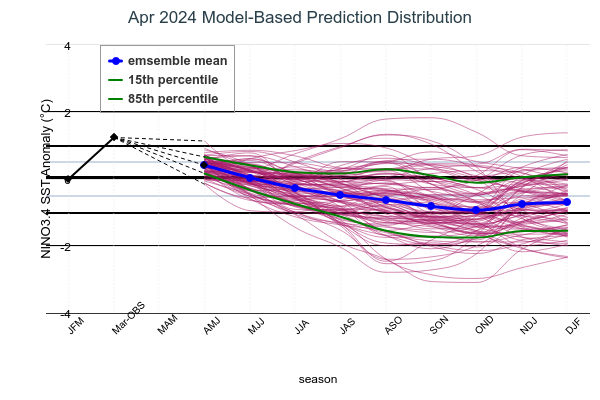
The latest set of ENSO prediction models from mid-April 2024 is now available in the IRI ENSO prediction plume. These are used to assess the probabilities of the three ENSO categories by using the average value of the NINO3.4 SST anomaly predictions from all models in the plume, equally weighted. A standard Gaussian error is imposed over that averaged forecast, with its width determined by an estimate of overall expected model skill for the season of the year and the lead time. Higher skill results in a relatively narrower error distribution, while low skill results in an error distribution with width approaching that of the historical observed distribution.
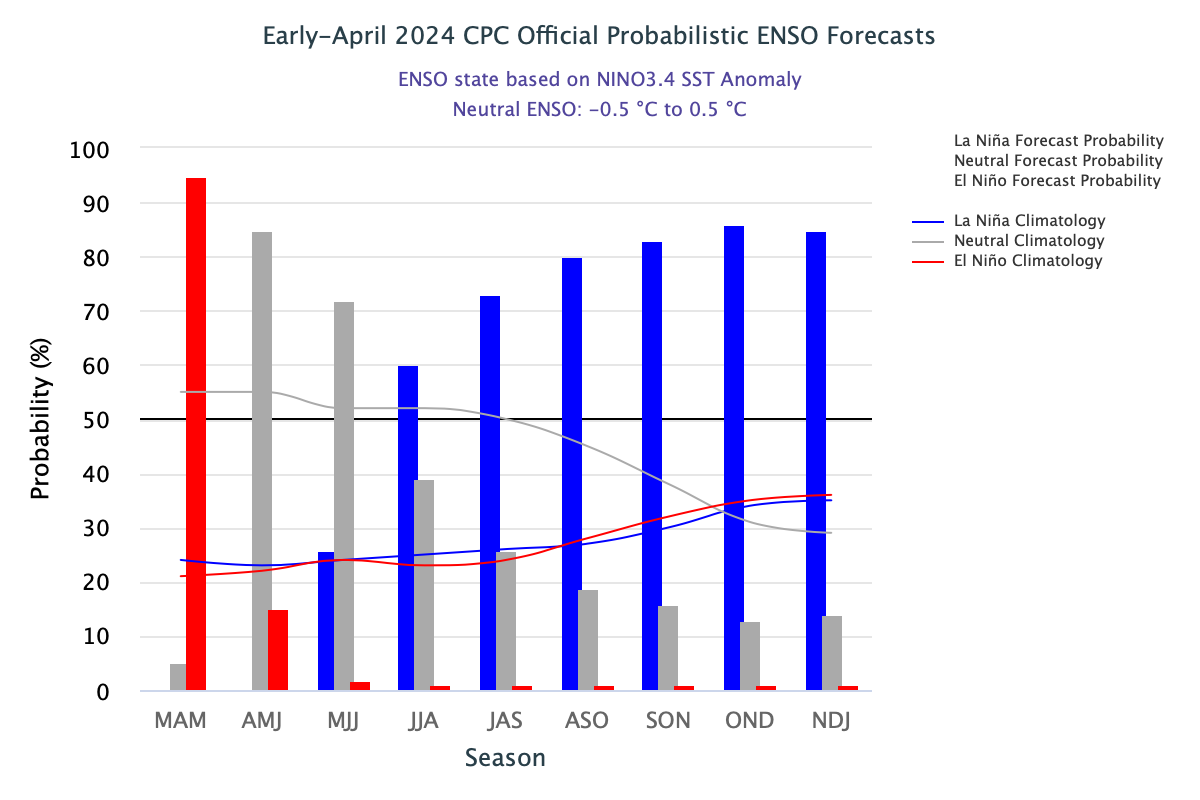
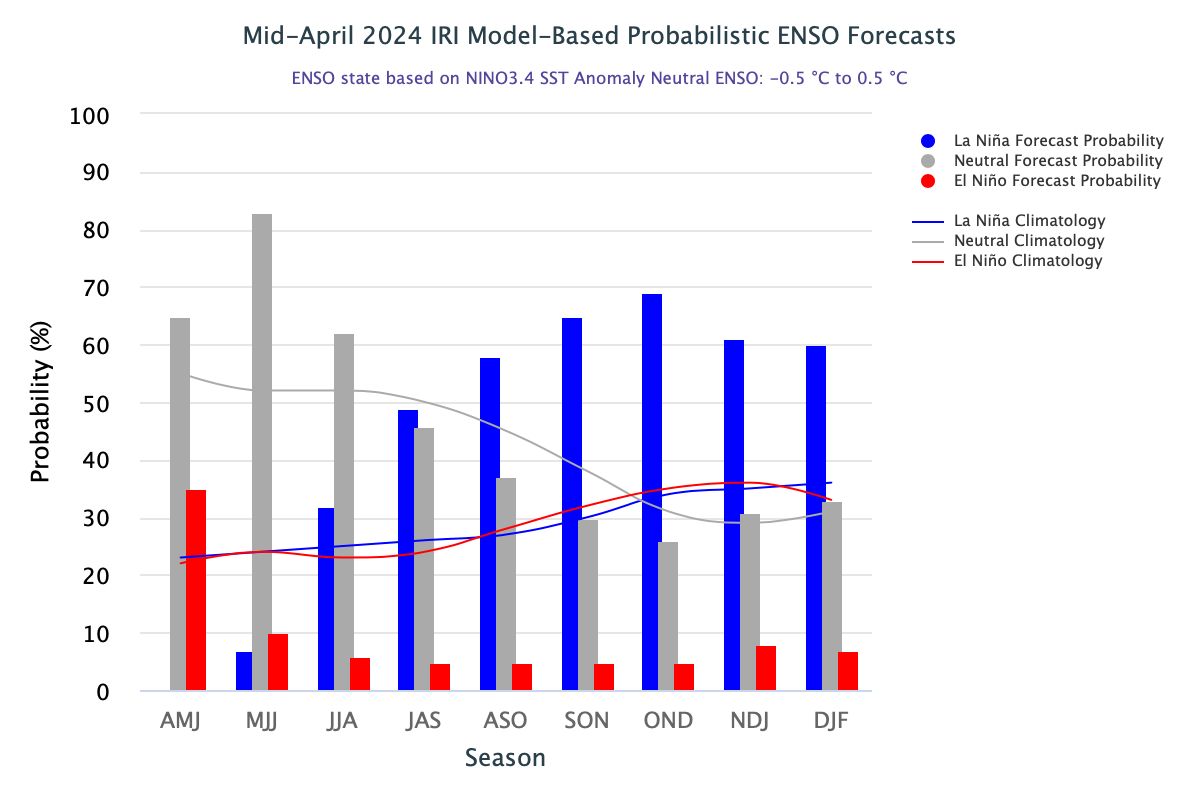
According to the ENSO forecast issued by the IRI, there is a high likelihood of ENSO-neutral conditions appearing during Apr-Jun (65%), and persisting during May-Jul (83%), and Jun-Aug (62%), 2024. In Jul-Sep 2024, ENSO-neutral and La Niña are equally likely though the La Niña (49% chance) is favored as compared to ENSO-neutral (46% chance). In Aug-Oct 2024, there is an anticipated transition to La Niña with 58% probability. La Niña then becomes the dominant category for the remainder of the forecast period, with probabilities of 65% in Sep–Nov, 69% in Oct–Dec, 61% in Nov–Jan, 60% in Dec–Feb, 2025. A plot of the probabilities summarizes the forecast evolution. The climatological probabilities for La Niña, ENSO-neutral, and El Niño conditions vary seasonally, and are shown by the lines on the plot, and are given in a table at the bottom of this page for each 3-month season.
Caution is advised in interpreting the forecast distribution from the Gaussian standard error as the actual probabilities, due to differing biases and performance of the different models. In particular, this approach considers only the mean of the predictions, and not the total range across the models, nor the ensemble range within individual models. At longer leads, the skill of the models degrades, and uncertainty in skill must be convolved with the uncertainties from initial conditions and differing model physics, which leads to more climatological probabilities in the long-lead ENSO Outlook than might be suggested by the suite of models. Furthermore, the expected skill of one model versus another has not been established using uniform validation procedures, which may cause a difference in the true probability distribution.
In summary, the forecast for Apr-Jun 2024 shows a high likelihood of a transition from El Niño conditions to a ENSO-neutral state (65%). The ENSO-neutral conditions then remain dominant for May-Jul, and Jun-Aug, 2024. The forecast shows almost equally likely chances for La Niña and ENSO-neutral during Jul-Sep, 2024, though La Niña is favored. La Niña becomes the most likely category in Aug-Oct, 2024 and is then expected to persist until the end of the forecast period in Dec–Feb 2025.
A caution regarding the model-based ENSO plume predictions (released mid-month) is that factors such as known specific model biases and recent changes in the tropical Pacific that the models may have missed, are not considered. This approach is purely objective. Those issues are taken into account in CPC’s official outlooks, which are issued early in the month, and which will include some human judgment in combination with the model guidance.
| Season |
La Niña |
Neutral |
El Niño |
| AMJ |
0 |
65 |
35 |
| MJJ |
7 |
83 |
10 |
| JJA |
32 |
62 |
6 |
| JAS |
49 |
46 |
5 |
| ASO |
58 |
37 |
5 |
| SON |
65 |
30 |
5 |
| OND |
69 |
26 |
5 |
| NDJ |
61 |
31 |
8 |
| DJF |
60 |
33 |
7 |