IRI ENSO Forecast
IRI Technical ENSO Update
Published: December 19, 2018
Note: The SST anomalies cited below refer to the OISSTv2 SST data set, and not ERSSTv4. OISSTv2 is often used for real-time analysis and model initialization, while ERSSTv4 is used for retrospective official ENSO diagnosis because it is more homogeneous over time, allowing for more accurate comparisons among ENSO events that are years apart. During ENSO events, OISSTv2 often shows stronger anomalies than ERSSTv4, and during very strong events the two datasets may differ by as much as 0.5 C. Additionally, the ERSSTv4 may tend to be cooler than OISSTv2, because ERSSTv4 is expressed relative to a base period that is updated every 5 years, while the base period of OISSTv2 is updated every 10 years and so, half of the time, is based on a slightly older period and does not account as much for the slow warming trend in the tropical Pacific SST.
Recent and Current Conditions
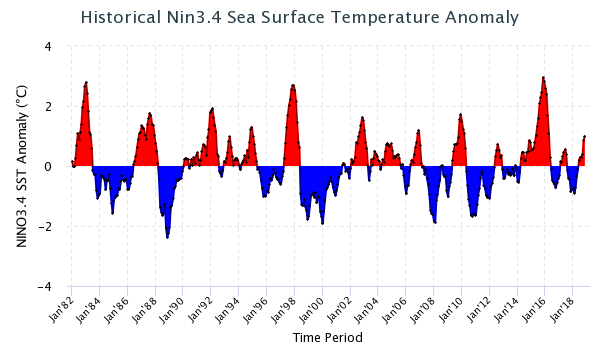
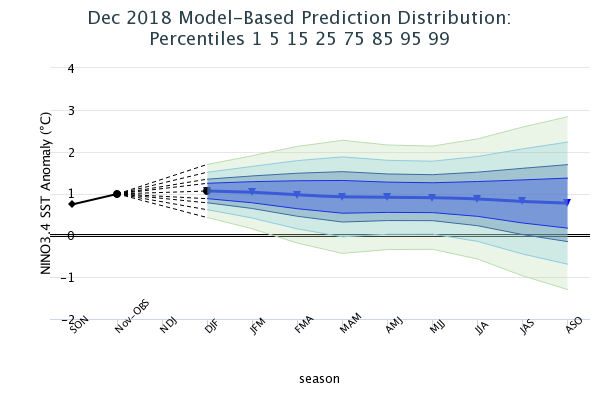
In mid-December 2018, weak/moderate El Niño SST conditions were observed in the NINO3.4 region. The November SST anomaly was 0.99 C, at the “top” of the weak El Niño range, and for Sep-Nov it was 0.74 C, also indicative of weak El Niño. The IRI’s definition of El Niño, like NOAA/Climate Prediction Center’s, requires that the SST anomaly in the Nino3.4 region (5S-5N; 170W-120W) exceed 0.5 C. Similarly, for La Niña, the anomaly must be -0.5 C or less. The climatological probabilities for La Niña, neutral, and El Niño conditions vary seasonally, and are shown in a table at the bottom of this page for each 3-month season. The most recent weekly anomaly in the Nino3.4 region was 1.1, indicating moderate El Niño conditions. The band of warmed SST extends somewhat west of the Date Line, making the typical west-to-east SST anomaly gradient weaker than normally seen in an El Niño event. In fact,the NINO4 index has been at least as strong as the NINO3.4 index over the last couple of months. Despite the warmed SSTs, however, many of the key atmospheric variables, such as the lower level zonal wind anomalies, the sea level pressure pattern (e.g., the Southern Oscillation index) and the outgoing longwave radiation pattern (convection), have not suggested El Niño conditions, but rather a continuation of ENSO-neutral conditions. The low-level wind anomalies have been weakly westerly during some weeks, but this indication of El Niño has been intermittent. The upper level zonal wind anomaly has been easterly in the eastern tropical Pacific, in line with El Niño expecations. But generally, coupling of the atmosphere to the oceanic conditions has been largely lacking. The subsurface temperature anomalies across the eastern equatorial Pacific remain markedly above-average. These warmed waters at depth extend to the surface, resulting in above-average temperatures, and also presaging likely continuation of above-average SST in the coming couple of months. Given the current El Niño-level SST anomalies, the subsurface profile, even with currently poor atmospheric coupling it appears likely that the SST will continue at weak or moderate El Niño levels into winter and possibly continue with at least weak strength through spring. This expectation assumes that the atmosphere will participate in the event more in the coming month or two.
Expected Conditions
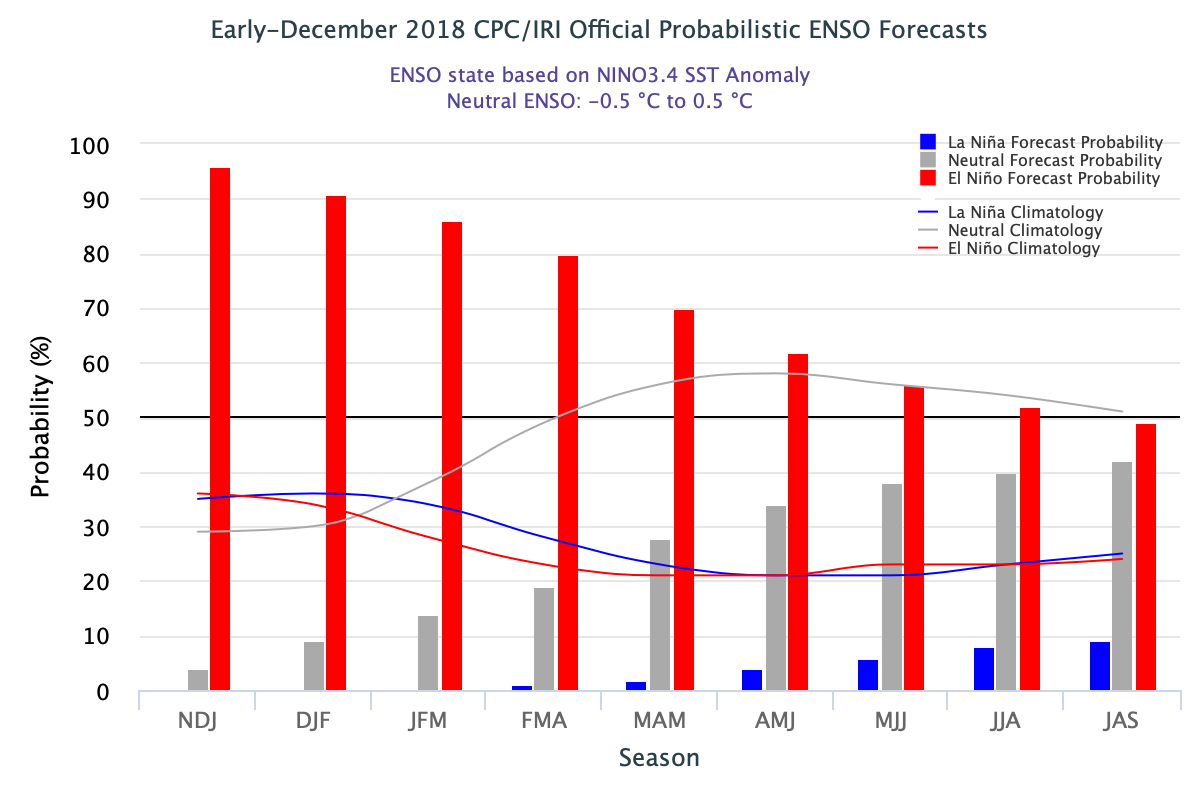
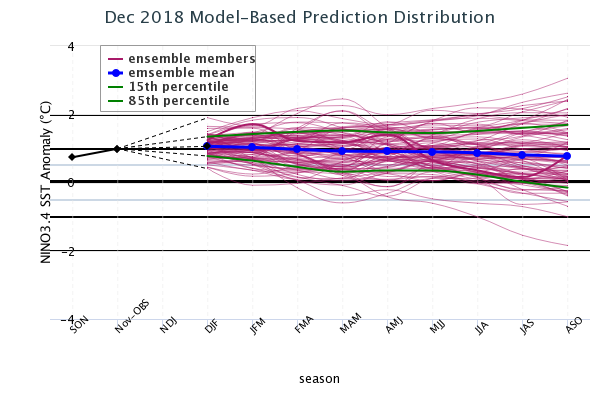
What is the outlook for the ENSO status going forward? The most recent official diagnosis and outlook was issued approximately one week ago in the NOAA/Climate Prediction Center ENSO Diagnostic Discussion, produced jointly by CPC and IRI; it gave a 90% chance for El Niño during the Dec-Feb season, and 60% chance for continuing during spring 2019. An El Niño watch remains active. The latest set of model ENSO predictions, from mid-December, now available in the IRI/CPC ENSO prediction plume, is discussed below. As of mid-December, at least 90% of the dynamical or statistical models predict El Niño conditions from the initial Dec-Feb 2018-19 season through May-Jul 2019, with less than 10% showing neutral conditions for this same range of seasons. From Jun-Aug through Aug-Oct, between 70 and 89% of models continue to predict El Niño. No model predicts La Niña for any season.
Note – Only models that produce a new ENSO prediction every month are included in the above statement.
Caution is advised in interpreting the distribution of model predictions as the actual probabilities. At longer leads, the skill of the models degrades, and skill uncertainty must be convolved with the uncertainties from initial conditions and differing model physics, leading to more climatological probabilities in the long-lead ENSO Outlook than might be suggested by the suite of models. Furthermore, the expected skill of one model versus another has not been established using uniform validation procedures, which may cause a difference in the true probability distribution from that taken verbatim from the raw model predictions.
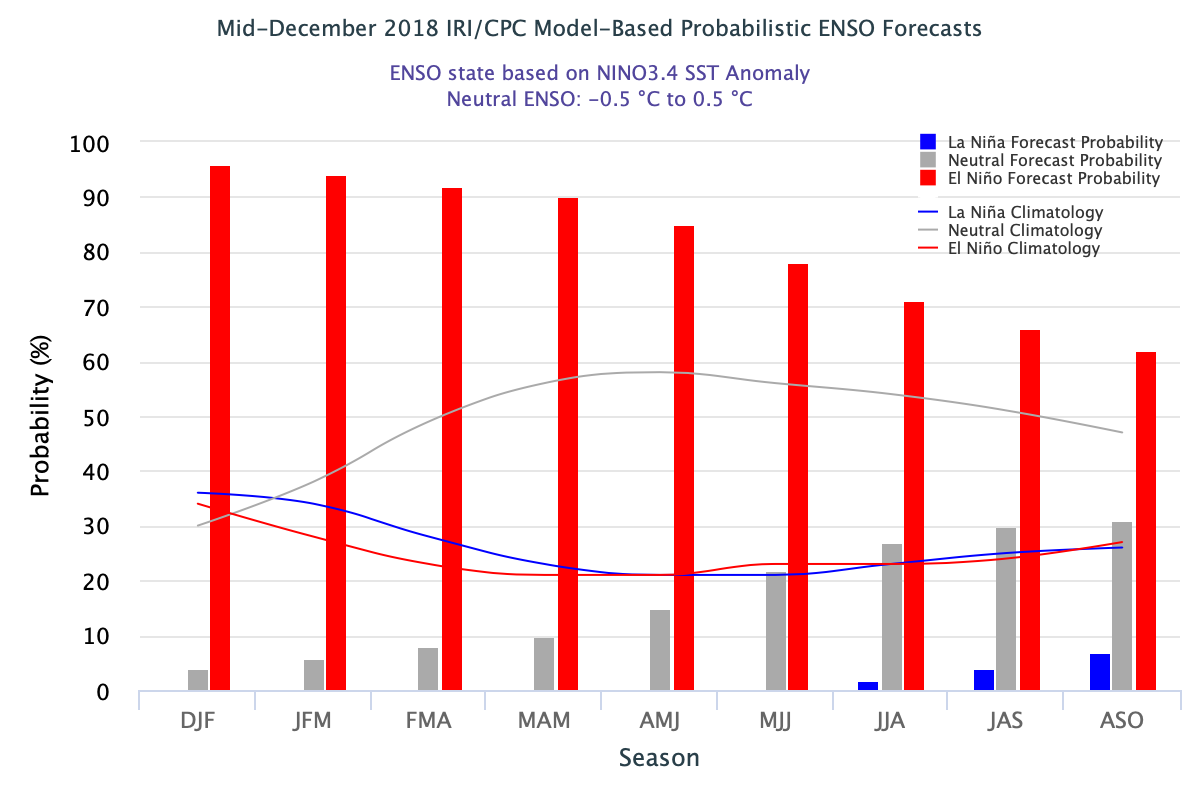
An alternative way to assess the probabilities of the three possible ENSO conditions is more quantitatively precise and less vulnerable to sampling errors than the categorical tallying method used above. This alternative method uses the mean of the predictions of all models on the plume, equally weighted, and constructs a standard error function centered on that mean. The standard error is Gaussian in shape, and has its width determined by an estimate of overall expected model skill for the season of the year and the lead time. Higher skill results in a relatively narrower error distribution, while low skill results in an error distribution with width approaching that of the historical observed distribution. This method shows probabilities for La Niña at near 0% from Dec-Feb through May-Jul, rising only to 7% by Aug-Oct. Probabilities for neutral conditions begin at 4% for Dec-Feb, rise slowly to 15% for Apr-Jun, and to about 30% for Jul-Sep and Aug-Oct. Probabilities for El Niño, which begin at 96% for Dec-Feb, stay at 90% or above through Mar-May, fall to 78% for May-Jul, and to 62% for Aug-Oct. The failure to drop below 50% by early autumn suggests a possibility for a two-year El Niño event. A plot of the probabilities generated from this most recent IRI/CPC ENSO prediction plume using the multi-model mean and the Gaussian standard error method summarizes the model consensus out to about 10 months into the future.
The same cautions mentioned above for the distributional count of model predictions apply to this Gaussian standard error method of inferring probabilities, due to differing model biases and skills. In particular, this approach considers only the mean of the predictions, and not the total range across the models, nor the ensemble range within individual models.
In summary, the probabilities derived from the models on the IRI/CPC plume describe, on average, a very strong tilt of the odds toward El Niño conditions from Dec-Feb through Mar-May 2019. Probabilities for La Niña are close to zero through May-Jul. A caution regarding this latest set of model-based ENSO plume predictions, is that factors such as known specific model biases and recent changes that the models may have missed will be taken into account in the next official outlook to be generated and issued early next month by CPC and IRI, which will include some human judgment in combination with the model guidance.
Climatological Probabilities
| Season |
La Niña |
Neutral |
El Niño |
| DJF |
36% |
30% |
34% |
| JFM |
34% |
38% |
28% |
| FMA |
28% |
49% |
23% |
| MAM |
23% |
56% |
21% |
| AMJ |
21% |
58% |
21% |
| MJJ |
21% |
56% |
23% |
| JJA |
23% |
54% |
23% |
| JAS |
25% |
51% |
24% |
| ASO |
26% |
47% |
27% |
| SON |
29% |
39% |
32% |
| OND |
32% |
33% |
35% |
| NDJ |
35% |
29% |
36% |
IRI/CPC Mid-Month Model-Based ENSO Forecast Probabilities
| Season |
La Niña |
Neutral |
El Niño |
| DJF 2018 |
0% |
4% |
96% |
| JFM 2019 |
0% |
6% |
94% |
| FMA 2019 |
0% |
8% |
92% |
| MAM 2019 |
0% |
10% |
90% |
| AMJ 2019 |
0% |
15% |
85% |
| MJJ 2019 |
0% |
22% |
78% |
| JJA 2019 |
2% |
27% |
71% |
| JAS 2019 |
4% |
30% |
68% |
| ASO 2019 |
7% |
31% |
62% |