IRI ENSO Forecast
IRI Technical ENSO Update and Model-Based Probabilistic ENSO Forecast
Published: June 22, 2026
ENSO Current State: Ocean–Atmosphere Overview
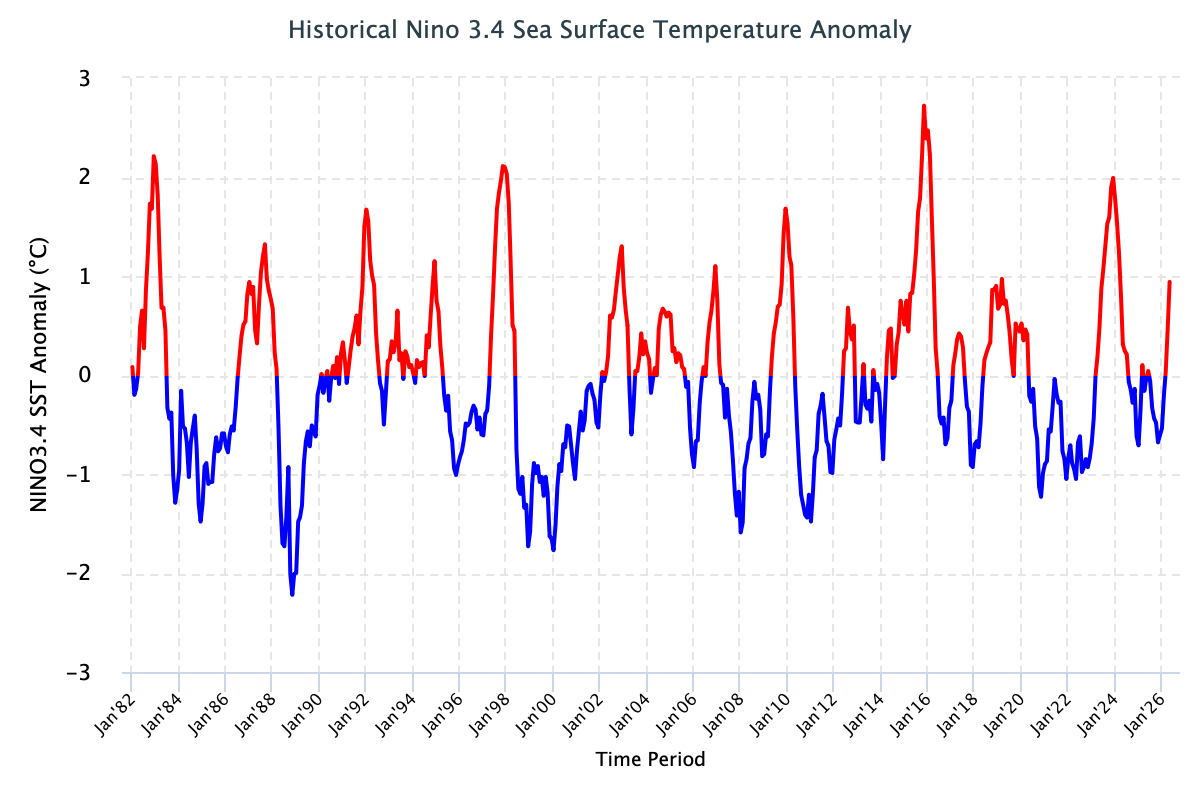
El Niño conditions are strengthening across the tropical Pacific, with SST anomalies in the Niño 3.4 region showing a steady upward trend. The observed SST anomaly reached +0.48 °C during March–May 2026 and increased to +0.94 °C in May 2026. The latest weekly Niño 3.4 index, centered on June 17, 2026, climbed further to +1.7 °C. Together, these observations indicate that Pacific Ocean conditions have transitioned into El Niño conditions and are continuing to intensify toward a moderate-strength El Niño event.
Both oceanic and atmospheric indicators are becoming increasingly aligned, supporting further intensification of the ongoing El Niño event. On the atmospheric side, the Southern Oscillation Index (SOI) declined to -14.5 in May 2026, while the latest 30-day SOI value through June 20 remained strongly negative at -21.9. These persistently negative SOI values reflect a further weakening of the Walker circulation, consistent with continued El Niño development and intensification. In addition, the Equatorial SOI declined to -1.0 during May 2026, further indicating that the atmosphere is starting to respond to the warming Pacific Ocean, a sign that ocean-atmosphere coupling associated with El Niño is becoming established. Low-level (850-hPa) westerly wind anomalies were observed across the western and east-central equatorial Pacific, indicating a weakening of the trade winds and supporting further El Niño intensification. Further, the subsurface temperature structure in the central–eastern equatorial Pacific exhibits a pronounced warming signal. Between approximately 150°W and 80°W, temperatures at depths of 50–150 m have increased substantially, with anomalies locally reaching up to 6 °C. This substantial subsurface heat reservoir could serve as an important energy source for the continued development and intensification of El Niño conditions, provided that favorable atmospheric coupling is maintained. In addition, ocean heat content anomalies (averaged over the upper 0–300 m) between the Date Line and 80°W are also markedly elevated. For context, current values are almost twofold than those observed during the same period in mid-June 2023, during the development phase of the 2023 El Niño event.
ENSO Probabilities
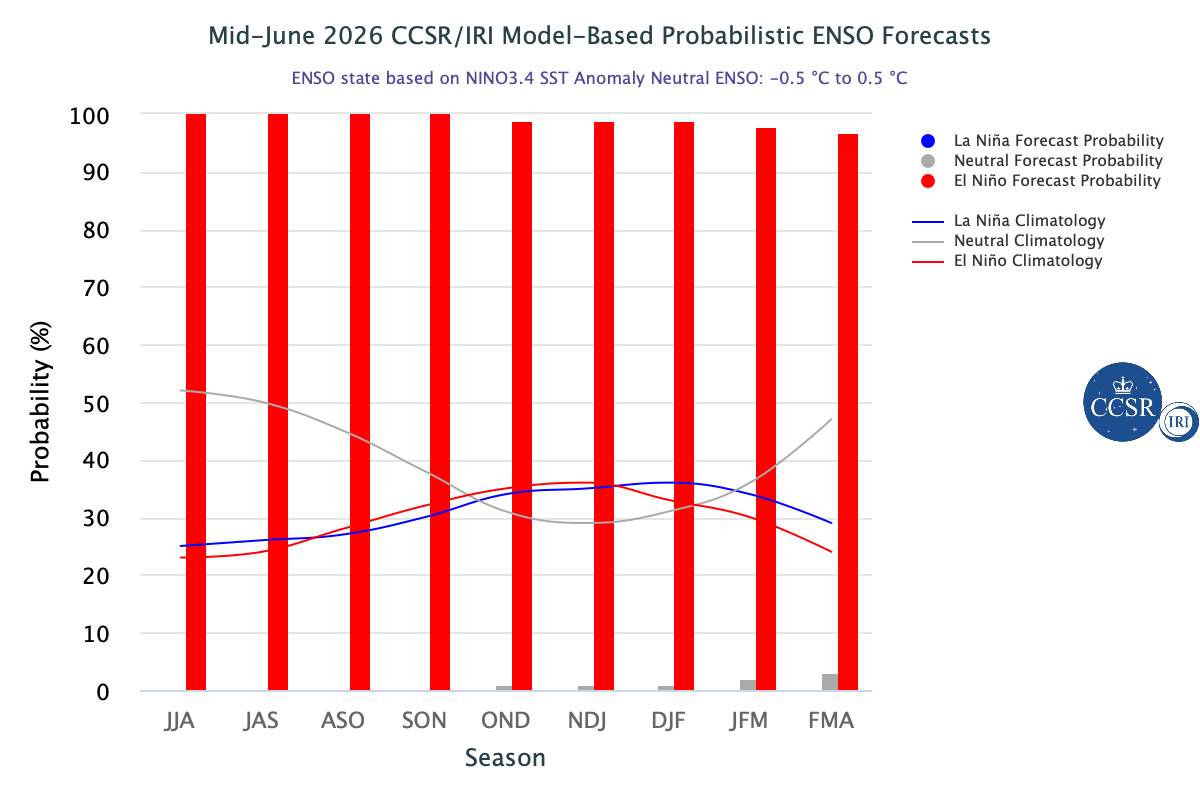
To generate the ENSO probability outlook, forecasts from all 24 participating models (15 dynamical and 9 statistical) are combined into an equally weighted multi-model average of Niño3.4 SST anomalies. A Gaussian error distribution is then applied to the ensemble-mean forecast, with its width determined by the expected forecast skill for the season and lead time. Higher forecast skill results in a narrower distribution and greater confidence, while lower skill produces a broader range of possible outcomes. Probabilities are calculated based on the likelihood of Niño3.4 SST anomalies falling within the standard ENSO thresholds: El Niño (≥ +0.5°C), ENSO-neutral (-0.5°C to +0.5°C), and La Niña (≤ -0.5°C). This methodology translates the multi-model forecast into probabilities for each ENSO category.
The June 2026 outlook strongly favors the persistence of El Niño conditions throughout the forecast period. El Niño probabilities are assigned at 100% from JJA through SON. From OND to DJF, the probabilities remain exceptionally high at 99%, followed by 98% and 97% for JFM and FMA, 2027 respectively, with the remaining probabilities assigned to ENSO-neutral conditions. No probability is assigned to La Niña development during this period. June marks the end of the boreal spring predictability barrier; therefore, the high-confidence outlook is consistent with strong model consensus and indicates a high likelihood of El Niño persisting into early 2027. The accompanying probability plot summarizes the forecast evolution and the changing likelihood of each ENSO phase throughout the forecast period.
ENSO Strength
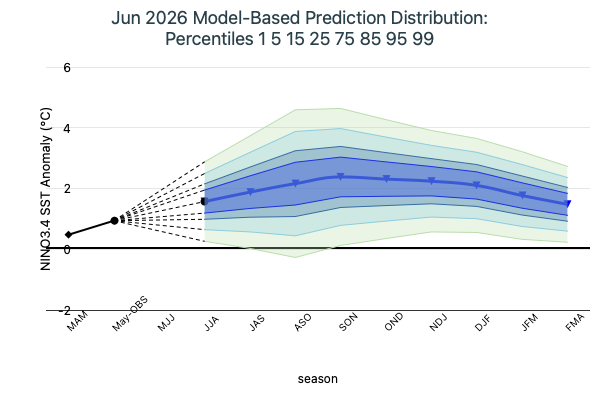
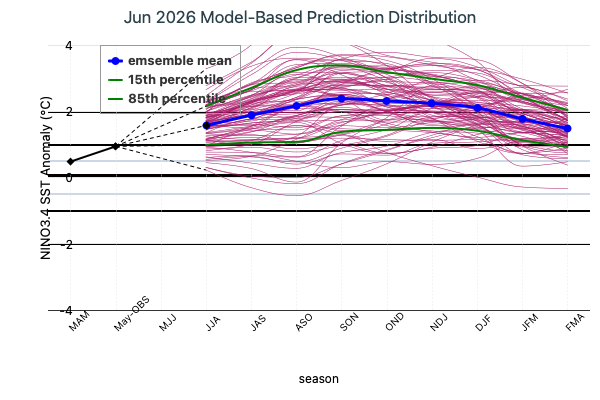
Forecasts of ENSO strength are estimated through a consensus-based model counting approach using a set of Niño 3.4 sea surface temperature anomaly thresholds, to indicate weak, moderate, strong and very strong El Nino and La Nina categories.
The mid-June 2026 CCSR/IRI model ensemble strongly favors a developing and intensifying El Niño event, with all models indicating El Niño conditions throughout the forecast period. The ensemble projects the highest intensity during SON 2026, when 13 out of 24 models indicate a very strong El Niño event (Niño 3.4 ≥ +2.0 °C), representing the peak of the forecasted event strength. Overall, the ensemble shows a strong and consistent signal for a continuing and intensifying El Niño event, with negligible likelihood of ENSO-neutral or La Niña conditions.
Notes:
The SST anomalies cited below are based on the NOAA Optimum Interpolation Sea Surface Temperature (OISSTv2)dataset. The climatology period is 1991–2020.
The primary metric used to monitor the El Niño–Southern Oscillation (ENSO) is the traditional Niño3.4 index (TONI), defined as the area-averaged sea surface temperature anomaly over the Niño3.4 region (5°S–5°N, 170°W–120°W).
According to the CCSR/IRI definition, El Niño conditions occur when monthly TONI exceeds +0.5 °C, while La Niña conditions occur when monthly TONI falls below −0.5 °C.
An ENSO “event” is considered established when the TONI threshold (±0.5 °C) persists for at least five consecutive overlapping 3-month seasons (e.g., SON, OND, NDJ, DJF, JFM).
The ENSO Intensity Classification used (based on TONI) is;
| El Niño Strength |
La Niña Strength |
| Weak: +0.5 to +1.0 °C |
Weak: −0.5 to −1.0 °C |
| Moderate: +1.0 to +1.5 °C |
Moderate: −1.0 to −1.5 °C |
| Strong: +1.5 to +2.0 °C |
Strong: −1.5 to −2.0 °C |
| Very Strong: > +2.0 °C |
Very Strong: < −2.0 °C |