IRI ENSO Forecast
IRI Technical ENSO Update
Published: February 20, 2023
Note: The SST anomalies cited below refer to the OISSTv2 SST data set, and not ERSSTv5. OISSTv2 is often used for real-time analysis and model initialization, while ERSSTv5 is used for retrospective official ENSO diagnosis because it is more homogeneous over time, allowing for more accurate comparisons among ENSO events that are years apart. These two products may differ, particularly during ENSO events. The difference between the two datasets may be as much as 0.5 °C. Additionally in some years, the ERSSTv5 may tend to be cooler than OISSTv2 in the context of warming trends, because ERSSTv5 is expressed relative to a base period that is updated every 5 years, while the base period of OISSTv2 is updated every 10 years. In February 2021, both datasets were updated to reflect the 1991-2020 climatology period.
Recent and Current Conditions
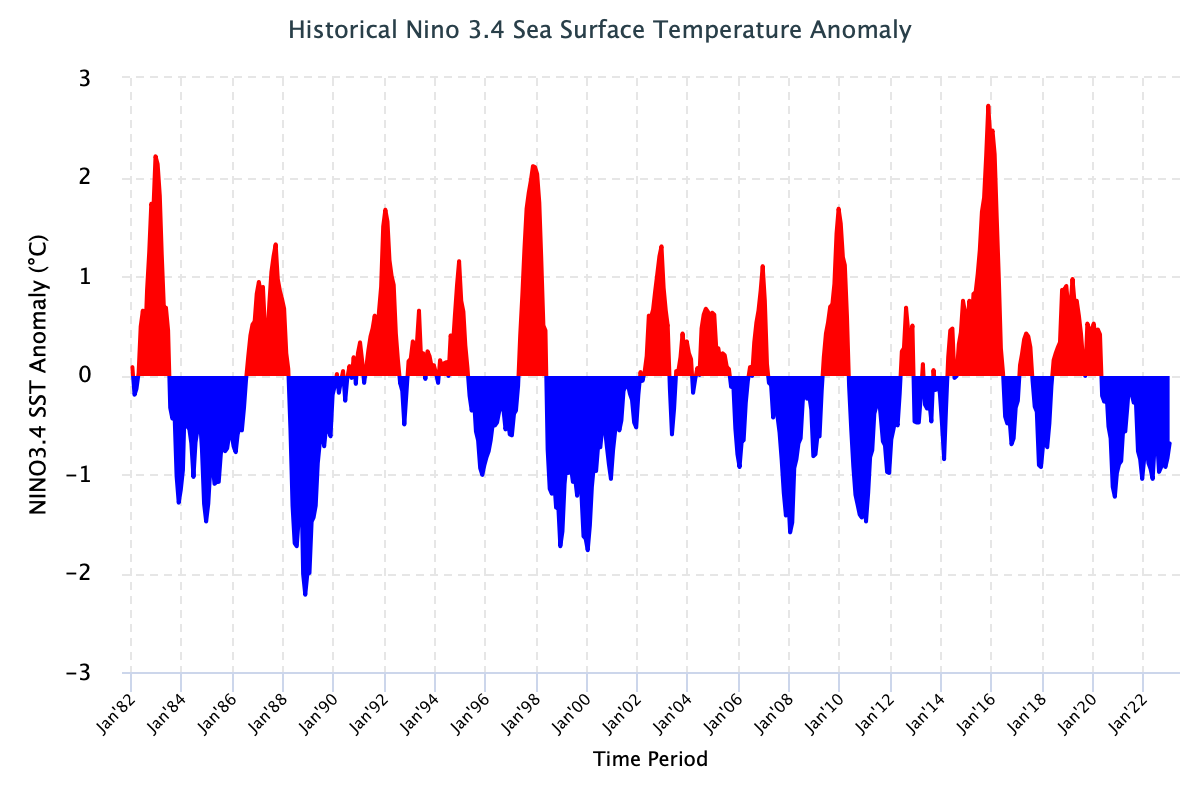
The SST anomaly for NINO3.4 during the Nov-Jan 2022 season was -0.82 °C, and for the month of January 2023 it was -0.69 °C. The most recent weekly (15 Feb 2023) anomaly in the NINO3.4 region was -0.5 °C, indicating weakened and now borderline La Niña conditions in the tropical Pacific. The IRI’s definition of El Niño, like NOAA/Climate Prediction Center’s, requires that the SST anomaly in the NINO3.4 region (5S-5N; 170W-120W) exceed 0.5 °C. Similarly, for La Niña, the anomaly must be -0.5 °C or colder.
Many of the key atmospheric variables remain indicative of La Niña conditions, such as the traditional and equatorial Southern Oscillation Indices which are positive, (as of 18 February 2023, the last observed value of the traditional Southern Oscillation Index was +14.1), the low-level easterly winds are stronger than normal across the central and western Pacific, and near average in the eastern Pacific. The upper-level wind anomalies remain westerly across the tropical Pacific, anomalously dry conditions have been observed over the central and western Pacific Ocean. However, in the ocean, positive subsurface temperatures have expanded eastward (up to 130W), though remaining mostly at depth (100 to 250 meters), except near the surface in the eastern Pacific Ocean (100W to 80W). Cold subsurface temperature anomalies have weakened and are now located mostly from 120W to 80W at depth (50 to 100 meters), although weak negative anomalies continue to reside near the surface in the central and western equatorial Pacific Ocean. In summary, current conditions indicate a weakened and now borderline La Niña in the tropical Pacific.
Expected Conditions
Note – Only models that produce a new ENSO prediction every month are considered in this statement.
What is the outlook for the ENSO status going forward?
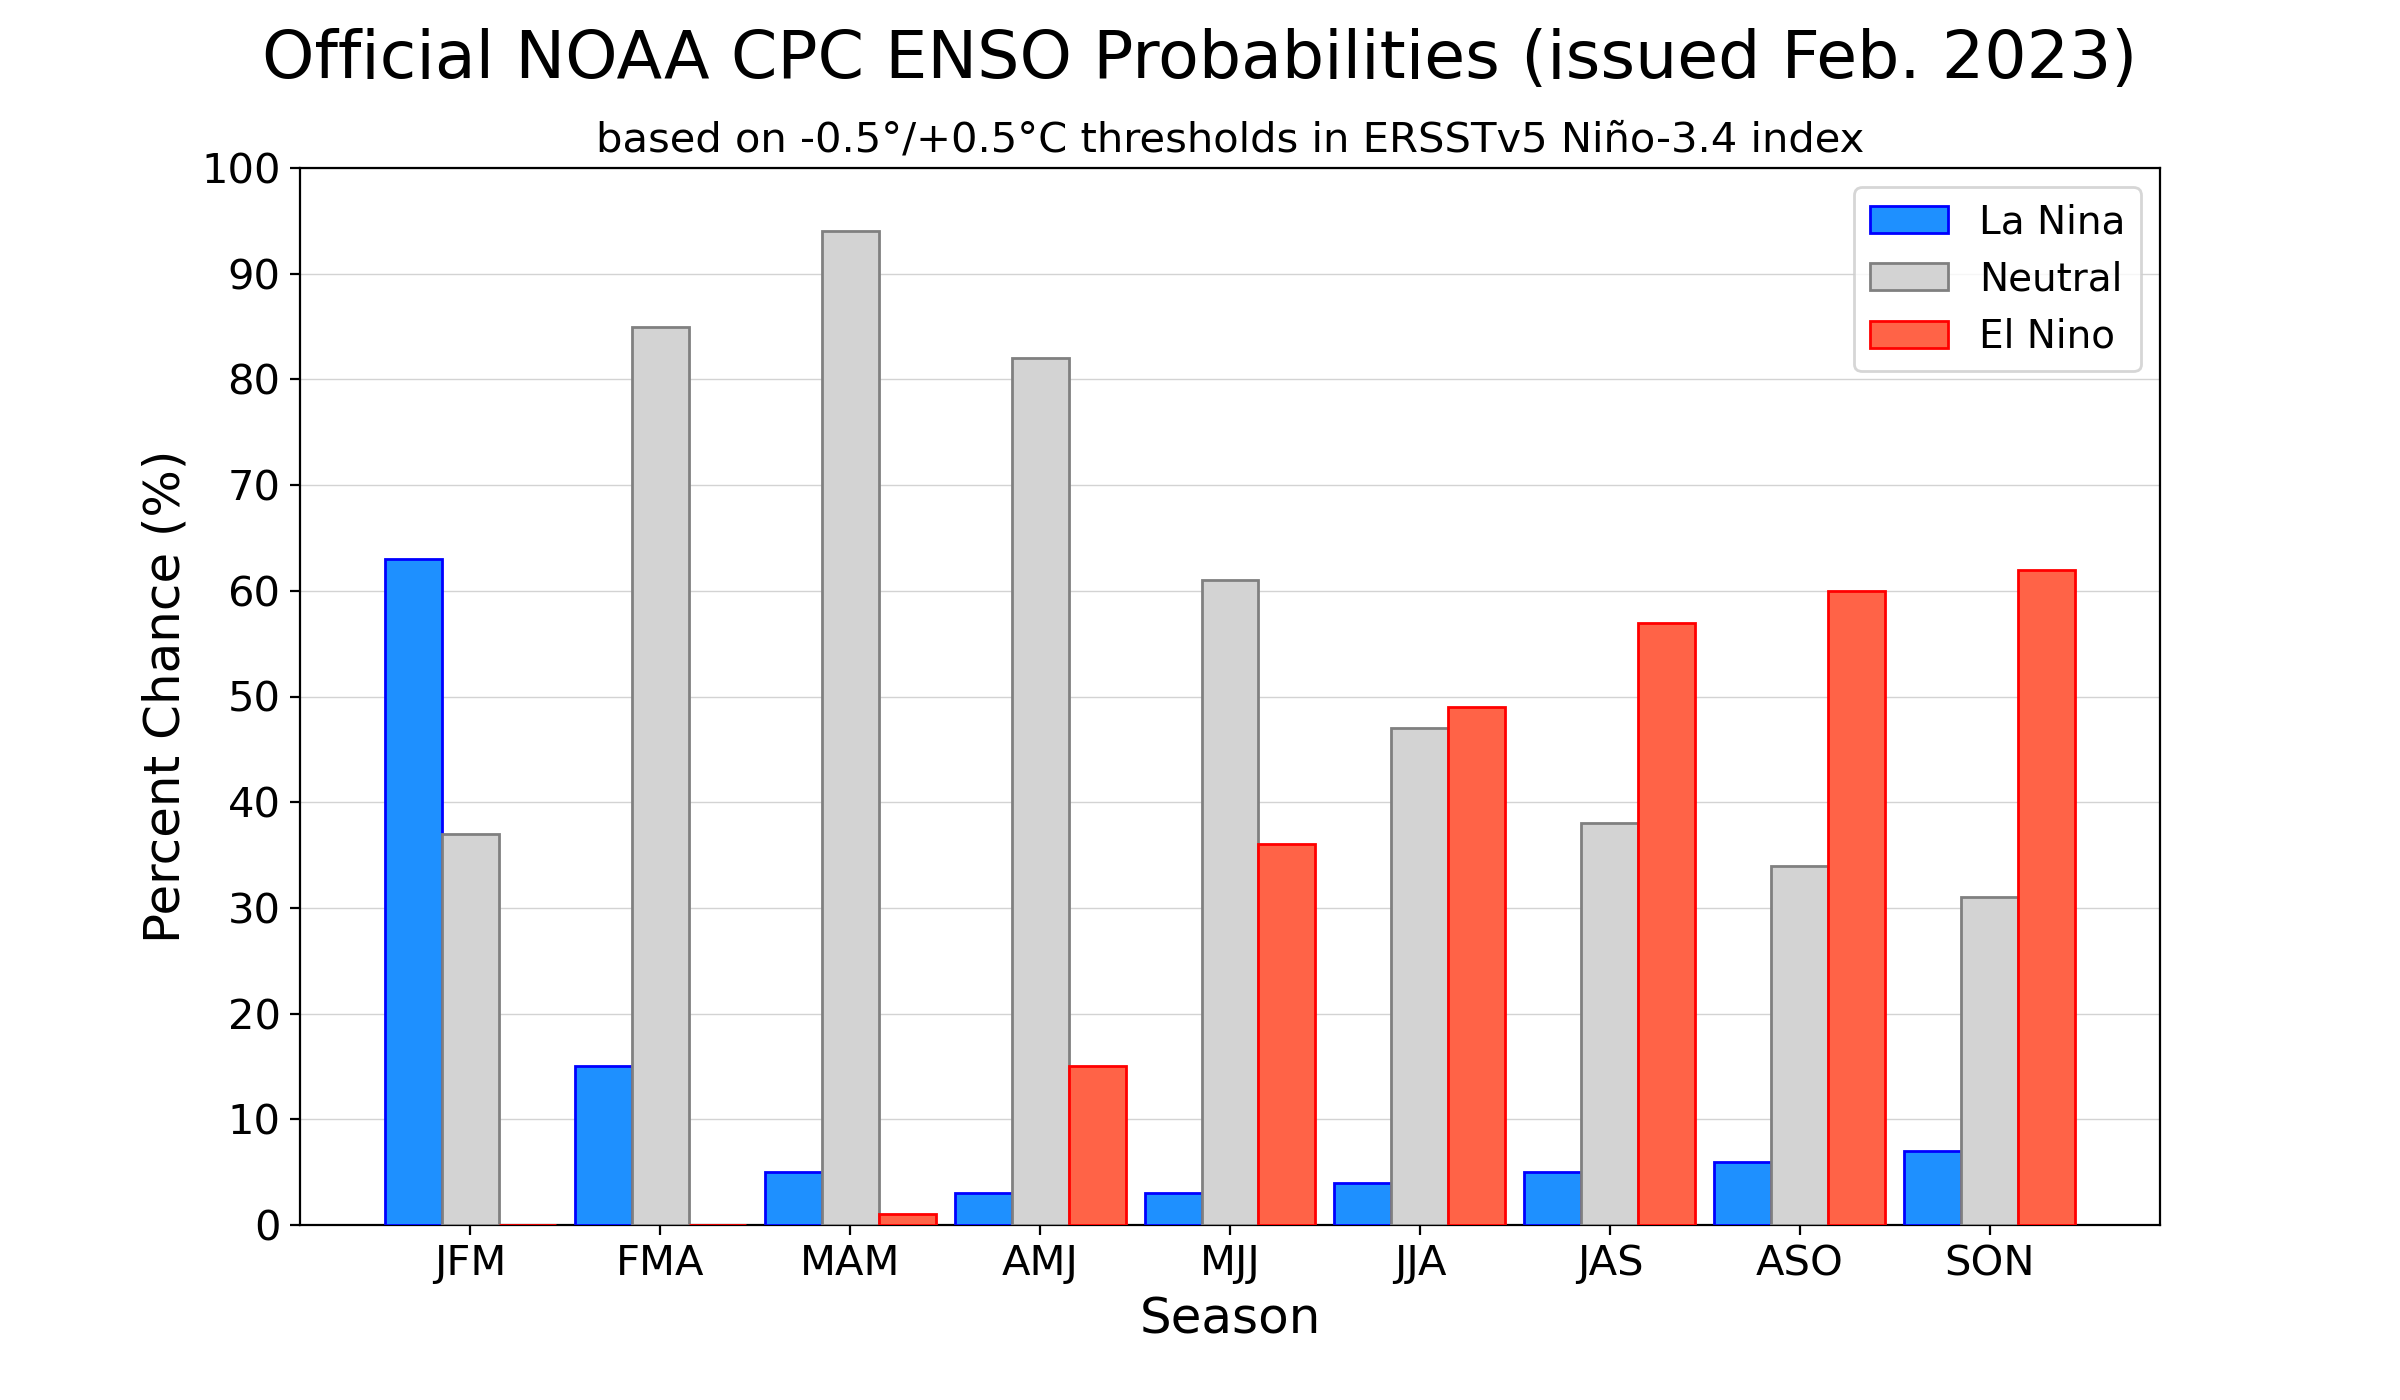
El Niño/Southern Oscillation (ENSO) Diagnostic Discussion issued on 09 February 2023 by the Climate Prediction Center/NCEP/NWS indicates a transition to ENSO-neutral conditions in next couple of months with high probabilities during Mar-May 2023 (94%).
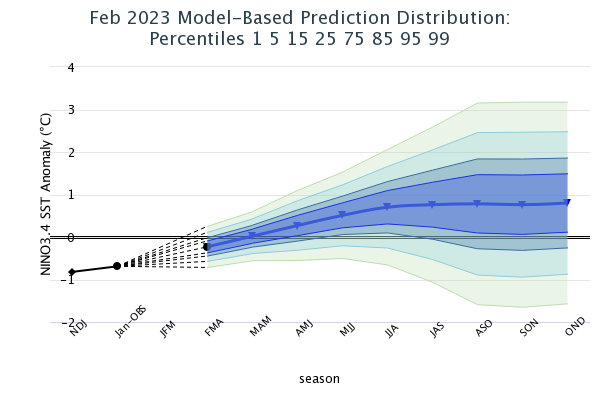
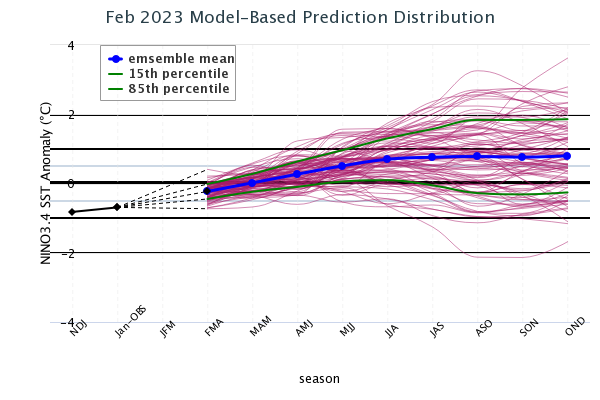
The latest set of ENSO prediction models from mid-February 2023 is now available in the IRI ENSO prediction plume. These are used to assess the probabilities of the three ENSO categories by using the average value of the NINO3.4 SST anomaly predictions from all models in the plume, equally weighted. A standard Gaussian error is imposed over that average forecast, and its width is determined by an estimate of overall expected model skill for the season of the year and the lead time. Higher skill results in a relatively narrower error distribution, while low skill results in an error distribution with width approaching that of the historical observed distribution.
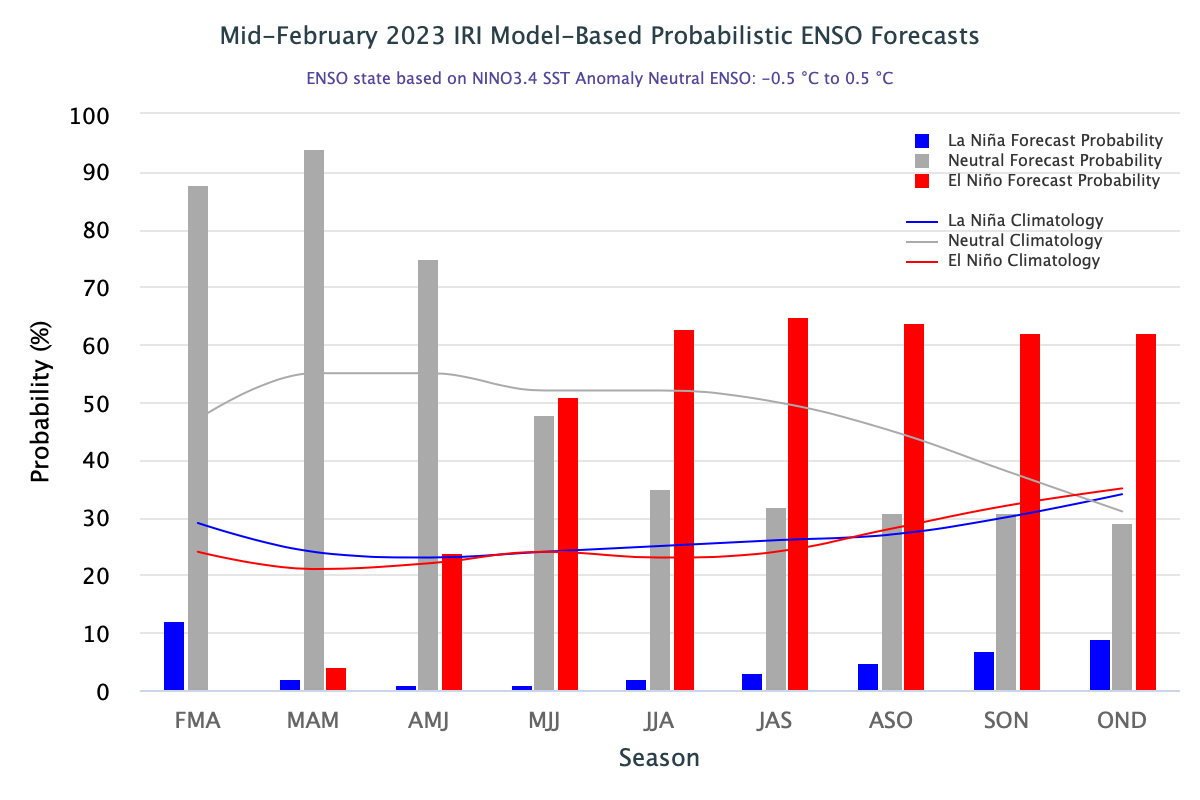
All models (except one statistical model) in the plume predict neutral sea surface temperatures during Mar-May 2023. The probability of ENSO-neutral during Mar-May is 94%, while that of the La Niña continuation is 3%. Going forward, ENSO-neutral conditions are highly favored for Apr-Jun (79%) and May-Jul (51%), while chances for El Niño increases from 3% in Mar-May to 20% in Apr-Jun, and 47% in May-Jul 2023. El Niño conditions become the most likely category starting from Jun-Aug (59%) with forecast probabilities in the range of 56-59% thereafter (59% in Jul-Sep, 59% in Aug-Oct, 56% in Sep-Nov, and 57% in Oct-Dec, 2023). A plot of the probabilities summarizes the forecast evolution. The climatological probabilities for La Niña, ENSO-neutral, and El Niño conditions vary seasonally, and are shown by the lines on the plot, and are given in a table at the bottom of this page for each 3-month season.
Caution is advised in interpreting the forecast distribution from the Gaussian standard error as the actual probabilities, due to differing biases and performance of the different models. In particular, this approach considers only the mean of the predictions, and not the total range across the models, nor the ensemble range within individual models. At longer leads, the skill of the models degrades, and uncertainty in skill must be convolved with the uncertainties from initial conditions and differing model physics, which leads to more climatological probabilities in the long-lead ENSO Outlook than might be suggested by the suite of models. Furthermore, the expected skill of one model versus another has not been established using uniform validation procedures, which may cause a difference in the true probability distribution.
In summary, the probabilities derived from the models in the IRI ENSO forecast plume indicate the termination of the current La Niña event in the next couple of months. ENSO-neutral is the dominant category during Mar-May (94% chance), Apr-Jun (79% chance) and May-Jul (51% chance), while the chances of La Niña are 3%, 1%, and 2% respectively. The likelihood of El Niño development remains low during boreal spring (4% in Mar-May, and 20% in Apr-Jun 2023), but increases to 47% in May-Jul, and become the dominant category during rest of the forecast period (56 to 59% chances). The chance of La Niña re-emerging are low (just under 10%) in the later part of the forecast period.
A caution regarding the model-based ENSO plume predictions released mid-month, is that factors such as known specific model biases and recent changes in the tropical Pacific that the models may have missed, are not considered. This approach is purely objective. Those issues are taken into account in the official outlooks, which are generated and issued early in the month by CPC, and which will include some human judgment in combination with the model guidance.
| Season |
La Niña |
Neutral |
El Niño |
| FMA |
12 |
88 |
0 |
| MAM |
2 |
94 |
4 |
| AMJ |
1 |
75 |
24 |
| MJJ |
1 |
48 |
51 |
| JJA |
2 |
35 |
63 |
| JAS |
3 |
32 |
65 |
| ASO |
5 |
31 |
64 |
| SON |
7 |
31 |
62 |
| OND |
9 |
29 |
62 |