September Climate Briefing: El Niño Waiting Game Continues
Read our ENSO Essentials & Impacts pages for more about El Niño and La Niña.
Tony Barnston provides an overview of the briefing:
What’s New
After months of neutral ENSO conditions and forecasts of an upcoming El Niño event, September has brought yet another month of the same. Sea-surface temperature (SST) anomalies in the equatorial Pacific Ocean region that defines El Niño events (called Niño3.4 – see below image) have remained about the same since last month’s briefing. Despite the persistence of SSTs in the neutral ENSO range, models continue to predict an El Niño event to develop, although they are now predicting a somewhat weaker event. Weekly SST anomalies in the Nino3.4 region averaged +0.28ºC over the last four weeks. For an El Niño to be established, that figure would have to stay above the +0.5ºC threshold for five consecutive, overlapping three-month averages.
Like the ocean, the atmosphere is not showing signs of immediate ENSO development. Winds over the past couple of months have gone back and forth from looking favorable to unfavorable to El Niño development, and the Southern Oscillation Index, an atmospheric measure, has stayed on the neutral side of the El Niño threshold. Since El Niño is a coupled system between the atmosphere and ocean, conditions in the two settings have to sync together to sustain an El Niño event for several months. More on how El Niño forms on our ENSO resource page.
"If we didn't have any models we'd be very doubtful of #ElNiño development,” says Barnston. “Because it's already September and it's not showing strong signs of developing.” #IRIforecast
— IRI (@climatesociety) September 20, 2018
One reason the models are still calling for development of an El Niño event is the anomalously warm water below the surface in the equatorial Pacific (see second image below). That heat has to go somewhere, and it’s usually released through the surface during El Niño events. Barnston says that even if an El Niño doesn’t come to fruition in the next few months, the warm waters below may be setting up for an appearance at the surface next year, and could spawn an El Niño event then.
In June, IRI and the National Oceanic and Atmospheric Administration’s Climate Prediction Center issued an El Niño Watch that remains in effect. The watch indicates conditions could favor development of El Niño in the next six months.
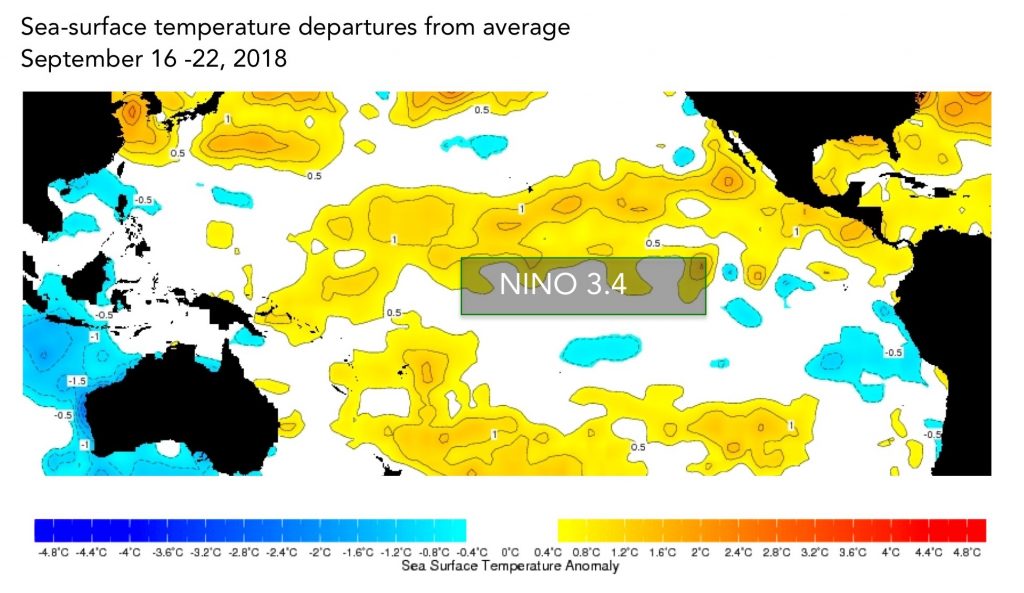
The sea-surface temperatures in the Nino3.4 region (approximated here) serve as a primary metric of El Niño and La Niña conditions. Data from the IRI Data Library. Image: IRI/Elisabeth Gawthrop
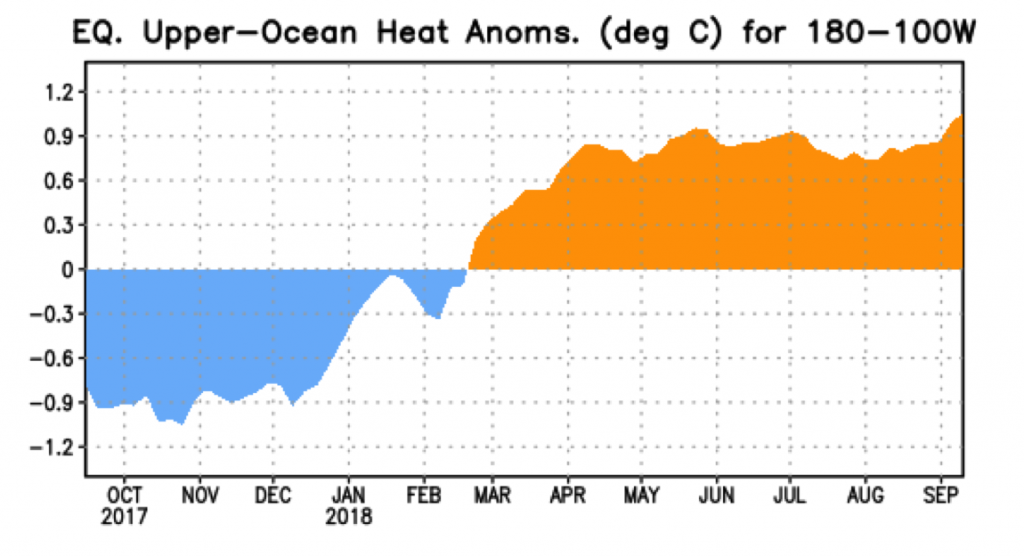
Since March of 2018, below-surface heat content in the equatorial Pacific Ocean has been above average.
ENSO Forecasts
To predict ENSO conditions, computers model the SSTs in the Nino3.4 region over the next several months. The plume graph below shows the outputs of these models, some of which use equations based on our physical understanding of the system (called dynamical models), and some of which use statistics, based on the long record of historical observations.
As in the last few months, models’ predictions of the SST anomalies in Nino3.4 show the development of a weak El Niño. Statistical models still predict the El Niño event to top out at the upper range of a weak event (i.e. close to the +1.0ºC moderate event threshold). Dynamical models, however, are down a bit — from a max of +0.95ºC in last month’s forecast to a max of +0.81ºC in the latest forecast.
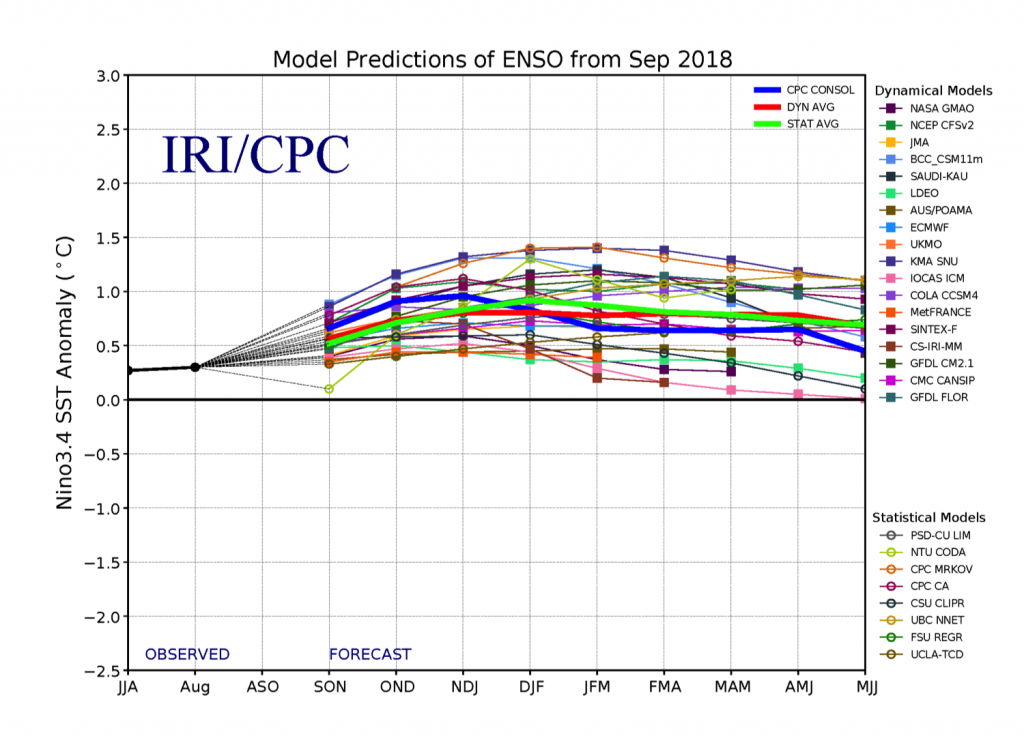
This graph shows forecasts made by dynamical and statistical models for SST in the Nino 3.4 region for nine overlapping 3-month periods. Note that the expected skills of the models, based on historical performance, are not equal to one another.
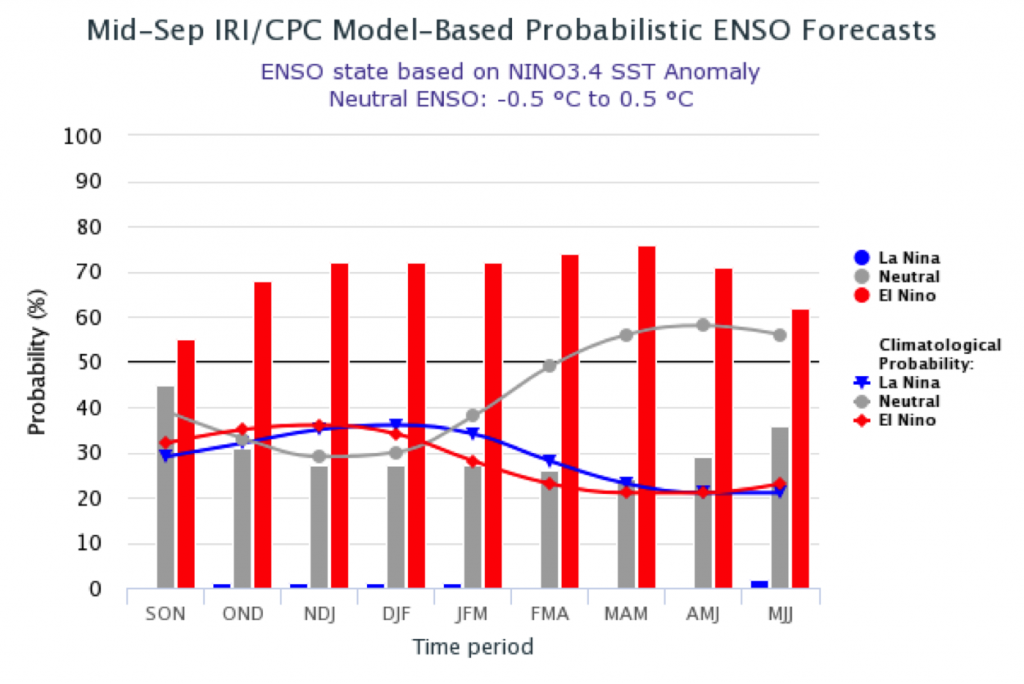
The IRI/CPC probabilistic ENSO forecast issued mid-September 2018. Note that bars indicate likelihood of El Niño occurring, not its potential strength. Unlike the official ENSO forecast issued at the beginning of each month, IRI and CPC issue this updated forecast based solely on model outputs. The official forecast, available at http://1.usa.gov/1j9gA8b, also incorporates human judgement.
Based on the model outputs, odds favor El Niño conditions to overtake the current neutral conditions in the current September – November season. The chances for El Niño conditions are somewhat lower in the official probabilistic forecast issued by CPC and IRI in early September than in this mid-month CPC/IRI forecast. This early-September forecast uses human judgement in addition to model output, while the mid-month forecast relies solely on model output. More on the difference between these forecasts in this IRI Medium post.
ENSO in context: Resource page on climate variability
Regarding the ending of the possible El Nino event, the official forecast calls for neutral conditions as the most likely ENSO state beginning in the April – June 2019 season, while odds remain high for El Niño during that season in the models.
IRI’s Global Seasonal Forecasts
Each month, IRI issues seasonal climate forecasts for the entire globe. These forecasts take into account the latest model outputs and indicate which areas are more likely to see above- or below-normal temperatures and precipitation.
Global seasonal forecasts for the coming months reflect the weak #ElNiño event that the models are forecasting. Access the forecasts here: https://t.co/NP0BfkIBdr #IRIforecast pic.twitter.com/aPgOqaifPD
— IRI (@climatesociety) September 20, 2018
For the upcoming October – December season, odds are strongly tipped in favor of below-normal rainfall across much of Indonesia and the Philippines. Australia, the Caribbean, northwestern United States, southern Chile, parts of northern South America and parts of the Sahel all have moderately increased odds for below-normal precipitation. Other parts of the Sahel have moderately increased odds for above-average precipitation, along with eastern equatorial Africa, northern Mexico and much of the Middle East. Southeastern South America has slightly increased odds for above-average precipitation.
All forecast maps, including temperature in addition to precipitation, and including a description of the methodologies, are available on our seasonal forecast page. Additional forecast formats, such as our flexible forecast maproom, are available in the IRI Data Library.
Learn more about El Niño and La Niña on our ENSO resources page, and sign up here to get notified when the next forecast is issued. In the meantime, check out #IRIforecast.
You must be logged in to post a comment.