August Climate Briefing: Winds Breathe Life into Probable El Niño Development
Read our ENSO Essentials & Impacts pages for more about El Niño and La Niña.
Tony Barnston provides an overview of the briefing:
What’s New
Sea-surface temperature (SST) anomalies in the equatorial Pacific Ocean have bounced around some since last month’s briefing, but models continue to predict an El Niño event to develop. Weekly SST anomalies in the area of the Pacific that helps define El Niño and La Niña events, called the Nino3.4 region (see first image below), are still within the neutral range, averaging +0.25ºC over the last four weeks. For an El Niño to be established, that figure would have to stay above the +0.5ºC threshold for five consecutive, overlapping three-month averages.
Since El Niño is a coupled system between the atmosphere and ocean, conditions in the two settings have to sync together to sustain an El Niño event for several months. Last month the winds in the equatorial Pacific were not indicative of El Niño development, but a recent burst of westerly winds could be a sign that the atmosphere is closer to syncing with the ocean and spurring El Niño conditions. The wind burst could also have kicked off a Kelvin wave beneath the surface of the ocean, which would increase the chances of El Niño developing. More on how El Niño forms on our ENSO resource page.
In June, IRI and the National Oceanic and Atmospheric Administration’s Climate Prediction Center issued an El Niño Watch that remains in effect. The watch indicates conditions could favor development of El Niño in the next six months.
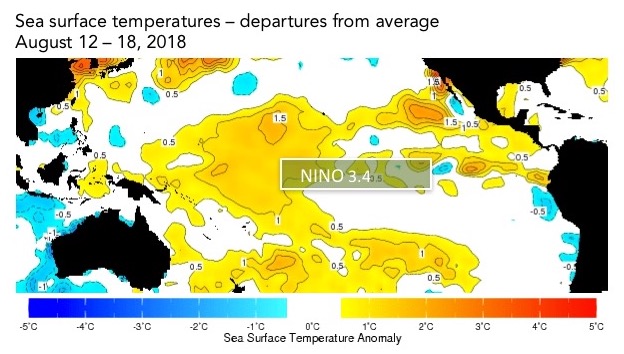
The sea-surface temperatures in the Nino3.4 region (approximated here) serve as a primary metric of El Niño and La Niña conditions. Data from the IRI Data Library. Image: IRI/Elisabeth Gawthrop
New westerly wind burst in the eastern Pacific could spawn a new Kelvin wave and encourage #ElNiño development. Barnston says dynamic models saw it coming. #IRIforecast pic.twitter.com/dA8vvOxUCW
— Elisabeth Gawthrop (@egawthrop) August 16, 2018
ENSO Forecasts
To predict ENSO conditions, computers model the SSTs in the Nino3.4 region over the next several months. The plume graph below shows the outputs of these models, some of which use equations based on our physical understanding of the system (called dynamical models), and some of which use statistics, based on the long record of historical observations.
As in the last few months, models’ predictions of the SST anomalies in Nino3.4 show the development of a weak El Niño. The means of both dynamical and statistical models peak between +0.9º and 1ºC in late 2018/early 2019.
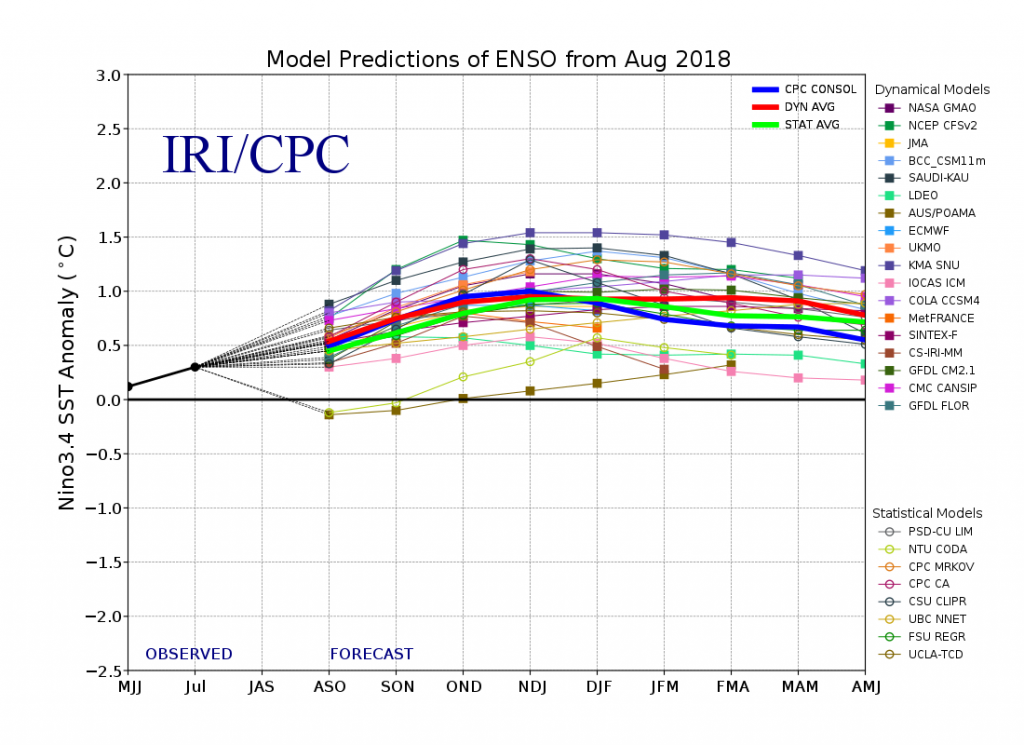
This graph shows forecasts made by dynamical and statistical models for SST in the Nino 3.4 region for nine overlapping 3-month periods. Note that the expected skills of the models, based on historical performance, are not equal to one another.
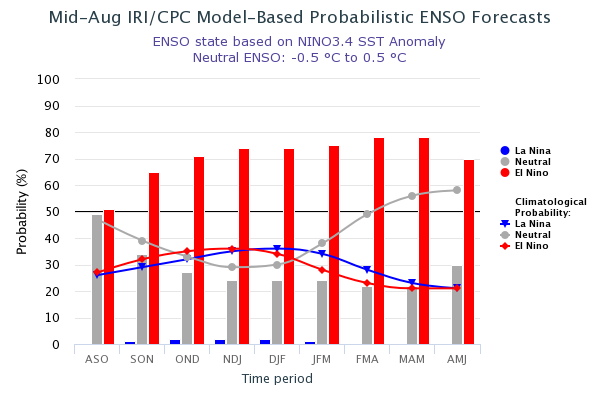
The IRI/CPC probabilistic ENSO forecast issued mid-August 2018. Note that bars indicate likelihood of El Niño occurring, not its potential strength. Unlike the official ENSO forecast issued at the beginning of each month, IRI and CPC issue this updated forecast based solely on model outputs. The official forecast, available at http://1.usa.gov/1j9gA8b, also incorporates human judgement.
Based on the model outputs, odds are nearly even for El Niño and neutral conditions during the current August – October season. El Niño takes a clearer lead, however, in the following months. eventually reaching over 75% in early 2019.
ENSO in context: Resource page on climate variability
The chances for El Niño conditions in the official probabilistic forecast issued by CPC and IRI in early August are similar to the mid-month CPC/IRI forecast, although with slightly lower overall odds for El Niño. The early-August forecast uses human judgement in addition to model output, while the mid-month forecast relies solely on model output. The other difference between the forecasts this month is that the models-only version retains higher odds for El Niño unusually late into 2019. More on the difference between these forecasts in this IRI Medium post.
IRI’s Global Seasonal Forecasts
Each month, IRI issues seasonal climate forecasts for the entire globe. These forecasts take into account the latest model outputs and indicate which areas are more likely to see above- or below-normal temperatures and precipitation.
Seasonal precip forecasts show classic ElNino pattern. Dry tendency in Australia, Indonesia, northern South Am, southern Africa, Caribbean, all the way through December. Northern Mex, southern US, Uruguay show enhanced prob. of above avg rainfall. #IRIforecast pic.twitter.com/9VsYrPAKVa
— IRI (@climatesociety) August 16, 2018
For the upcoming August – October season, odds are strongly tipped in favor of below-normal rainfall across much of Indonesia, the Philippines and Australia. Northern South America, the Caribbean and Central America also have increased odds for below-normal precipitation. Areas with some chance of above-normal precipitation include eastern equatorial Africa and the western United States. The central and western Sahel show scattered areas of both drier- and wetter-than-average rainfall.
All forecast maps, including temperature in addition to precipitation, and including a description of the methodologies, are available on our seasonal forecast page. Additional forecast formats, such as our flexible forecast maproom, are available in the IRI Data Library.
Learn more about El Niño and La Niña on our ENSO resources page, and sign up here to get notified when the next forecast is issued. In the meantime, check out #IRIforecast.
You must be logged in to post a comment.