What do we mean by “El Niño?”
The El Niño-Southern Oscillation (ENSO) is one of the most important and longest-studied climate phenomena on the planet. It can lead to large-scale changes in sea-level pressures, sea-surface temperatures, precipitation and winds–not only in the tropics but across many other regions of the world. ENSO describes the natural year-to-year variations in the ocean and atmosphere in the tropical Pacific. Sea-surface temperatures in the central and eastern equatorial Pacific cycle between above- and below-average. An El Niño state occurs when the central and eastern equatorial Pacific sea-surface temperatures are substantially warmer than usual (see Figure 1, top). La Niña conditions occur when the central and eastern equatorial Pacific waters are substantially cooler than usual (see Figure 1, bottom). A La Niña event usually, although not always, follows an El Niño event.
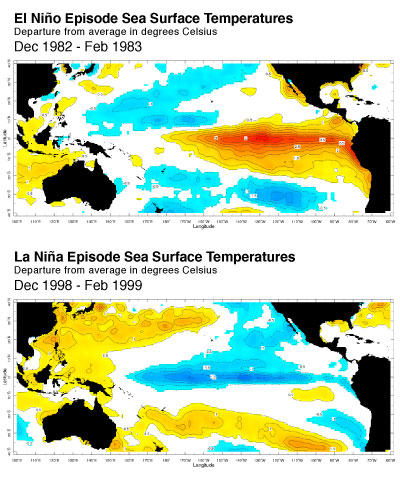
Figure 1: Sea-surface temperature anomalies during a strong El Niño event (top) and La Niña event (bottom). Figures made in the IRI ENSO Maproom.
El Niño refers to the ocean component of ENSO. Before 20th century scientists studied ENSO, Peruvian fisherman observed the warmer ocean waters off of the South American coast and the impact the temperature had on their fisheries. They named the phenomenon El Niño (the boy child) because the effects were often seen most prominently during the Christmas season. The Southern Oscillation part of the term ENSO refers to the atmospheric component: the shifting of atmospheric pressure between the central/eastern Pacific and the western Pacific.
What are neutral conditions?
Several years of neutral (or normal) conditions can persist between La Niña and El Niño events. In order to understand the ENSO cycle, we must first understand what the Pacific is like in its neutral state.
The equatorial Pacific climate acts as a “coupled system” because the state of the ocean and atmosphere depend on each other. As the conditions of the ocean change, the atmosphere responds, and vice versa. The main indicators of these changes are pressure and temperature. See Figure 2 (top) for a graphic illustrating neutral conditions.
Air Pressure
During neutral years (and on average) atmospheric pressure is low in the warmer western tropical Pacific (referenced at Darwin, Australia), and relatively higher in the cooler central/eastern tropical Pacific (referenced at Tahiti). Air naturally moves from areas of high pressure to low pressure, so this difference in pressure moves the equatorial air, known as the trade winds, from the coast of South America toward the western Pacific Ocean.
Ocean Temperatures
The sun heats water at the surface of the ocean, but the trade winds push surface water by friction from east to west in the Pacific. Cold water from below moves up to replace the shifted surface water in a process referred to as upwelling. During neutral conditions, waters in the eastern Pacific are upwelled along the equator and the coast of South America. Because the upwelled equatorial and coastal waters originate deep below the surface, they are cold and rich with nutrients. When the surface water arrives in the western Pacific, land surfaces restrict its further movement and so the water “piles up”, making sea level approximately half a meter higher around Indonesia than it is off the coast of Ecuador. As the water accumulates and stagnates, it continues to warm.
Neutral, El Niño and La Niña conditions in the equatorial Pacific. The illustrations show how the coupled ocean-atmosphere system typically behaves during each event. Images from the Australian Bureau of Meteorology.
The Coupled System
Because low-level winds move toward warm surface waters in the tropics, the difference in sea-surface temperatures (SSTs) between the cooler eastern Pacific and warmer western Pacific reinforces the easterly trade winds during neutral conditions. This east-west SST gradient induces strong easterly winds, which force water to the west and cause greater upwelling of colder water in the east. The cold upwelled waters also increase the east-west SST gradient, again reinforcing the strong easterly trade winds across the Pacific. The ocean and the atmosphere thus create a coupled system that continues this process until it is disrupted.
What changes during El Niño years?
Perturbations to the ocean that cause changes in the main temperature patterns affect the winds in this coupled system, which can lead to a positive feedback loop. During El Niño, this loop often begins with weakened, or sometimes even reversed, trade winds. The source of the weakened winds is not always apparent, but depending on their strength and how long they last, they may trigger Kelvin waves. These waves are 100-200 meters below the sea surface and hundreds of kilometers wide, and they make water warmer as they travel eastward across the equatorial Pacific (learn more about Kelvin waves here). Sometimes, these warmer waters make their way to the surface, and a “tongue” of warm surface water forms – typically warmer by 1-3 degrees Celsius and stretching across the equatorial Pacific. The warmer waters lower air pressure across the central and eastern Pacific, weakening the pressure gradient that would normally force the trade winds from Tahiti toward Darwin. The weaker trade winds reduce the amount of surface water pushed to the west, and the surface water stays warm and reinforces the weakened pressure gradient. This feedback can sustain El Niño conditions for more than a year. See Figure 2 (middle) for a graphic illustrating El Niño conditions.
The direct effects of the changes in temperature and pressure often include increased rainfall along the western coast of the Americas, and decreased rainfall around Indonesia and Australia.
What is La Niña?
La Niña occurs as an enhanced version of the neutral state. When air pressure is higher-than-average in Tahiti and lower-than-average in Australia, the easterly trade winds blow more intensely than usual. The colder-than-normal ocean water extends across the eastern and central equatorial Pacific, and the winds continue to push water westward, once again increasing the sea level around Indonesia. The water in the western Pacific warms up, which then increases precipitation in the region. See Figure 2 (bottom) for a graphic illustrating La Niña conditions.
How do we measure ENSO?
Because of the social implications for announcing a developing El Niño, measurements must be verified and accurate. One ENSO indicator is the Southern Oscillation Index (SOI), which is calculated using the pressure differential between Tahiti and Darwin. The SOI is negative during El Niño years and positive during La Niña years. Because the SOI measurements can reflect local variability and weather disturbances, scientists usually average the readings over a 5-month period to determine whether the pressure fluctuations indicate a major event.
Additionally, the U.S. National Oceanographic and Atmospheric Administration (NOAA) maintains monitoring buoys called the Tropical Atmosphere Ocean (TAO) Array across the equatorial Pacific Ocean. The buoys record and transmit sea surface and sub-surface temperatures, atmospheric conditions, water currents and wind data to scientists and researchers around the world in real time.
Figure 3: Niño regions. (Source: NOAA)
The region monitored by the TAO array is split into different sections (see Figure 3), each of which has a different implication for the likelihood of ENSO. For instance, the NINO1+2 area may be the first to warm during an El Niño, the NINO3 region experiences the most temperature variability, and NINO4 readings are a strong indicator for precipitation conditions over Indonesia. It is the readings over NINO3.4 – capturing both the important SST variability and the changes of strong precipitation – that inform most predictions about how ENSO events may affect global climate variability and shifting rainfall patterns.
How do we know when El Niño or La Niña is happening?
Scientists who monitor the atmospheric and oceanic data in the Pacific track how temperature and pressure measurements deviate from the average and how long this persists.
The designation of how far above or below normal the sea surface temperatures and/or atmospheric pressure must be – and how long they must persist – to qualify an El Niño or La Niña event varies slightly among different forecast centers and countries.
While there is no single agreed-upon ENSO indicator, NOAA defines an El Niño (or La Niña) event when the NINO3.4 area has sea-surface temperatures at least 0.5º Celsius warmer (or cooler) than normal for five consecutive three-month-averaged periods.
Why does ENSO matter? Learn more about the effects of El Niño and La Niña on global weather, climate and society.
Delve into the science
What to know more? Here are some recent publications from IRI scientists studying ENSO models and forecasts:
Barnston, A. G., Tippett, M. K., 2013: Predictions of Nino3.4 SST in CFSv1 and CFSv2: a diagnostic comparison. Climate Dynamics, 41, 1615-1633. DOI: 10.1007/s00382-013-1845-2
Barnston, A. G., Tippett, M. K., L’Heureux, M.L.; et al., 2012: Skill of real-time seasonal ENSO model predictions during 2002-2011: Is Our Capability Increasing? Bulletin of the American Meteorological Society, 93, 631-651. DOI: 10.1175/BAMS-D-11-00111.1 http://journals.ametsoc.org/doi/abs/10.1175/BAMS-D-11-00111.1
Barnston, A. G., Tippett, M. K., Shuhua, L., 2012: Performance of Recent Multimodel ENSO Forecasts. J. Appl. Meteor. Climatol., 51, 637-654. DOI: 10.1175/JAMC-D-11-093.1
Barnston, A. G., Shuhua, L., Mason, S.J., et al., 2010: Verification of the First 11 Years of IRI’s Seasonal Climate Forecasts. J. Appl. Meteor. Climatol., 49, 493-520. DOI: 10.1175/2009JAMC2325.1
You must be logged in to post a comment.