December Climate Briefing: Atmosphere Resists El Niño Participation
Read our ENSO Essentials & Impacts pages for more about El Niño and La Niña.
Tony Barnston provides an overview of the briefing:
What’s New
Typically, as we near the end of a calendar year, there is relative certainty about the anticipated state of the El Niño Southern Oscillation in the coming months. At this time of year, the ENSO cycle is in a less chaotic state, and we can usually tell whether it’s going to be El Niño, La Niña or neither.
Unfortunately, the recent pattern — El Niño-like conditions in the ocean but lack of atmospheric participation — has held on stubbornly. Sea-surface temperatures are still above average in the equatorial region of the Pacific Ocean that defines El Niño events (called Niño3.4 – see tweet below), and they’ve been above the +0.50ºC anomaly threshold that helps define El Niño since the week of September 24, 2018.
The atmosphere, however, has actually become less El Niño-like in the last month. Whether the atmosphere begins participating will determine if an El Niño event is officially declared in the coming months. Why aren’t the El Niño winds and other atmospheric indicators kicking in? It’s not just sea surface temperatures in Niño3.4 that matter, it’s also the overall pattern across the equatorial Pacific. Since there are warmer-than-average SSTs across the basin all the way to the west-central Pacific, the typical El Niño changes in circulation aren’t as likely to happen. More on how El Niño forms on our ENSO resource page.
For an El Niño to be made official in the historical record, the Niño3.4 SST anomaly would have to stay above the +0.5ºC threshold for five consecutive, overlapping three-month averages. There is a 96% chance, based on the models, for El Niño SST conditions in the current December – February season. Scientists from IRI and the National Oceanic and Atmospheric Administration’s Climate Prediction Center (CPC) are waiting for atmospheric El Niño conditions to make an appearance before declaring an El Niño advisory, which would mean that El Niño conditions are observed and expected to continue. In June, CPC/IRI issued an El Niño Watch, which remains in effect.
Seasonal temperature and precipitation forecasts based on the latest data show some influence from the predicted El Niño. The strongest effects on precipitation patterns are in Indonesia, the Philippines and western Australia, with moderate-to-high odds for drier-than-average conditions. In the United States, there are only slightly raised odds for a wetter-than-average winter across the southern part of the country, and northern California has an elevated chance of drier-than-average conditions. See more on the seasonal forecasts further down in this post.
ENSO Forecasts
To predict ENSO conditions, computers model the SSTs in the Nino3.4 region over the next several months. The plume graph below shows the outputs of these models, some of which use equations based on our physical understanding of the system (called dynamical models), and some of which use statistics, based on the long record of historical observations.
Model predictions of the SST anomalies in Nino3.4 continue to show the development of an El Niño. The averages of both the dynamical and statistical models predict an El Niño event right on the weak/moderate borderline of +1.0ºC for the next several months, and then a dip into the weak category for the remainder of the forecast period. This forecast is nearly unchanged from last month’s.

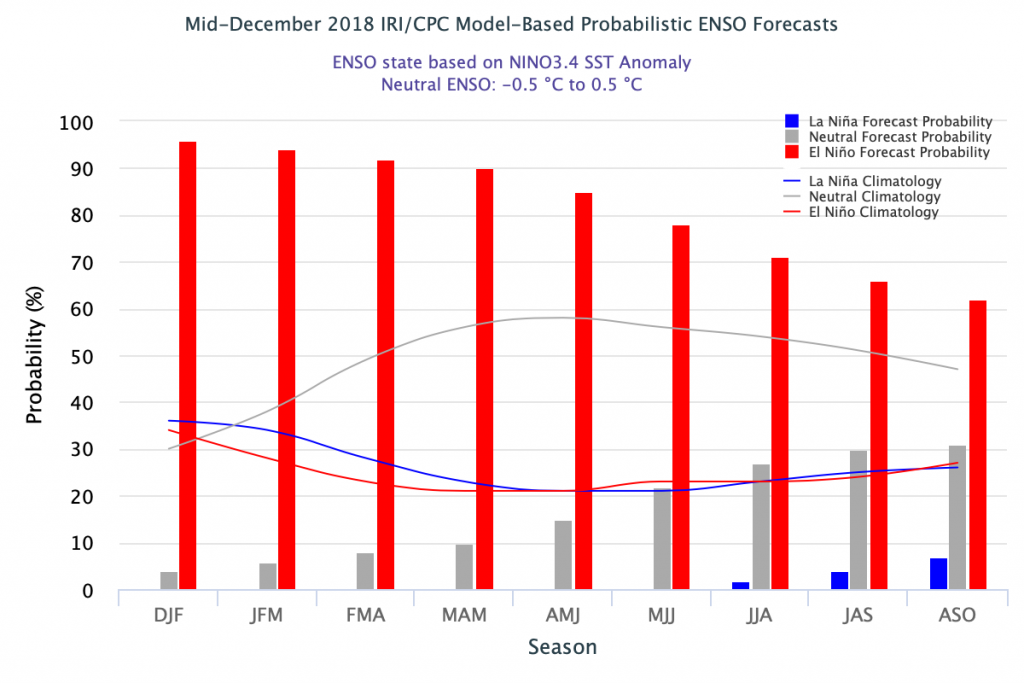
Based on the model outputs, odds for El Niño conditions are at or above 90% through the March – May season. The chances for El Niño conditions are slightly lower in the official probabilistic forecast issued by CPC and IRI in early December than in this mid-month CPC/IRI forecast. This early-December forecast uses human judgement in addition to model output, while the mid-month forecast relies solely on model output. More on the difference between these forecasts in this IRI Medium post.
ENSO in context: Resource page on climate variability
Regarding the ending of the possible El Niño event, both the official forecast and the models-only forecast call for El Niño conditions as the most likely ENSO state through the remainder of the forecast period. More on the possibility of an El Niño event next year, and comparison to the 2014-2016 El Niño activity, in last month’s briefing update.
IRI’s Global Seasonal Forecasts
Each month, IRI issues seasonal climate forecasts for the entire globe. These forecasts take into account the latest model outputs and indicate which areas are more likely to see above- or below-normal temperatures and precipitation.
For the upcoming January – March season, odds are moderately to strongly tipped in favor of below-normal rainfall across the Philippines, parts of Indonesia, northern and western Australia, southern Africa, Central America, the Caribbean, and northern California. Above-normal precipitation is not predicted with as high odds or over as broad areas as below-normal precipitation is predicted, but there are many areas with somewhat enhanced odds for above-normal precipitation, including Mongolia and the U.S.-Mexico border region.
All forecast maps, including temperature in addition to precipitation, and also including a description of the methodologies, are available on our seasonal forecast page. Additional forecast formats, such as our flexible forecast maproom, are available in the IRI Data Library.
Learn more about El Niño and La Niña on our ENSO resources page, and sign up here to get notified when the next forecast is issued. In the meantime, check out #IRIforecast.
You must be logged in to post a comment.