November Climate Briefing: El Niño Odds Keep Climbing
Read our ENSO Essentials & Impacts pages for more about El Niño and La Niña.
Tony Barnston provides an overview of the briefing:
What’s New
Sea-surface temperatures have remained above average in the equatorial region of the Pacific Ocean that defines El Niño events (called Niño3.4 – see tweet below). The SSTs have been above the +0.50ºC anomaly threshold that helps define El Niño since the week of September 24, 2018. The atmosphere, however, has not similarly shown clear signs of El Niño. Whether the SSTs stay elevated and whether the atmosphere begins participating will determine if an El Niño event is officially declared in the coming months. More on how El Niño forms on our ENSO resource page.
One sign of El Niño is convection (i.e. rain and thunderstorms) along certain parts of the equator. We’re just starting to see some signs of that convection, which scientists think drives the chain of events that lead to changes in jet stream and other atmospheric dynamics that ultimately influence weather and climate around the world.
The latest weekly Nino3.4 SST anomaly is 0.8ºC, which is within the weak El Niño range. This map and more in our data library: https://t.co/sxpdQ5lhvl. + More about ENSO: https://t.co/GldQNBgs3D. pic.twitter.com/kuXDzYYEgE
— IRI (@climatesociety) November 13, 2018
For that convection to get going, there needs to be a gradient of relatively cool to relatively warm SSTs from west to east across the equatorial Pacific. So far that gradient is not appearing, and this season is in some ways looking more like the quasi-El Niño of 2014. However, as this month’s NOAA ENSO blog notes, “there are some key differences this time around (sea surface temperatures are a little warmer, and subsurface temperatures are much warmer), so we’re not predicting an identical outcome. Plus, one thing you can bet on is that nature will never behave exactly the same way twice.” More about what warming in different parts of the Pacific could mean in this older NOAA ENSO blog post.
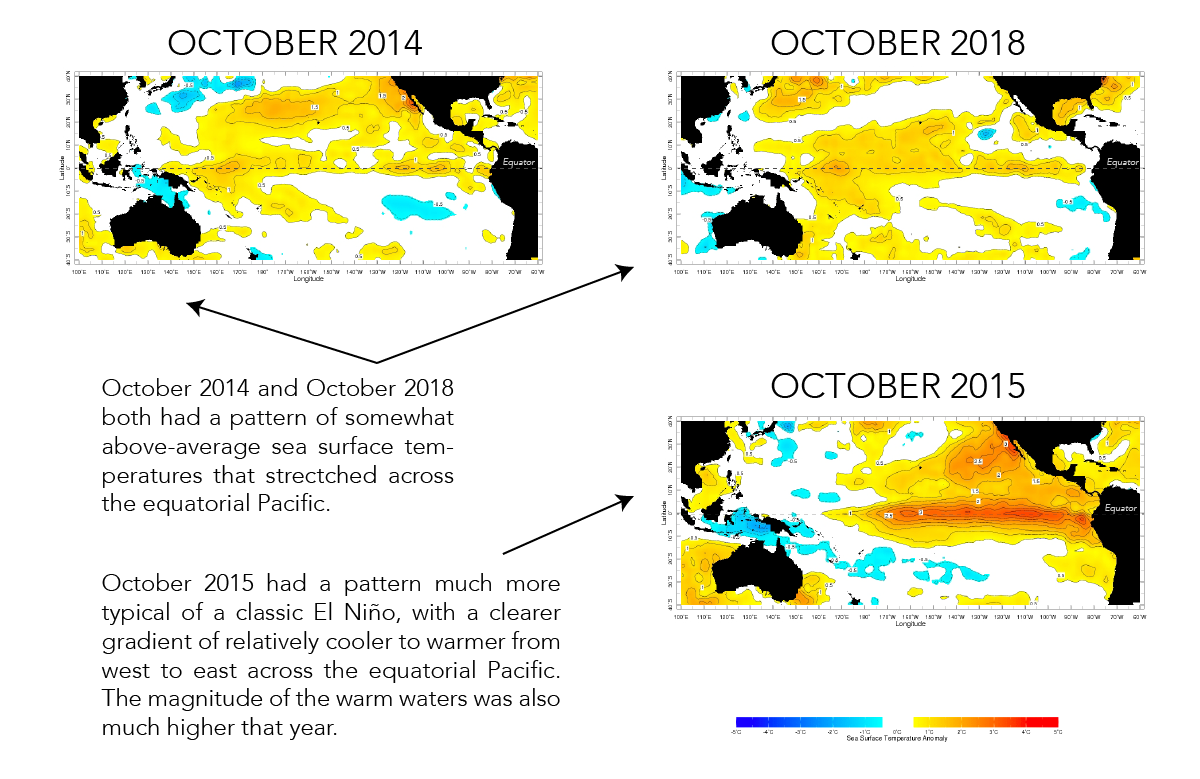
A comparison of October sea-surface temperatures in the Pacific Ocean, from the years 2014, 2015 and 2018. Made with maps from the IRI Data Library ENSO Maproom.
Could we be in for another strong El Niño event, like the 2015-16 El Niño that followed 2014? It’s really much too early to even speculate, but the model runs for 2015 from November 2014 are not dissimilar from this month’s model outputs. In fact, this month’s models (see below) solidly call for El Niño conditions to persist through the end of the forecast period (i.e. next July-September). But uncertainty is high for models looking that far ahead, especially for the period that is past the spring predictability barrier.
For an El Niño to be made official in the historical record, the Niño3.4 SST anomaly would have to stay above the +0.5ºC threshold for five consecutive, overlapping three-month averages. There is a 95% chance, based on the models, for El Niño SST conditions in the current November – January season. Scientists from IRI and the National Oceanic and Atmospheric Administration’s Climate Prediction Center (CPC) are waiting for atmospheric El Niño conditions to make an appearance before declaring an El Niño advisory, which would mean that El Niño conditions are observed and expected to continue. In June, CPC/IRI issued an El Niño Watch, which remains in effect.
Seasonal temperature and precipitation forecasts based on the latest data show some influence from the predicted El Niño. The strongest effects on precipitation patterns are in Indonesia, the Philippines and western Australia, with moderate-to-high odds for drier-than-average conditions. The El Niño signal for United States precipitation patterns is not as strong as some years, with only slightly raised odds for a wetter-than-average winter across the southern part of the country. See more on the seasonal forecasts further down in this post.
ENSO Forecasts
To predict ENSO conditions, computers model the SSTs in the Nino3.4 region over the next several months. The plume graph below shows the outputs of these models, some of which use equations based on our physical understanding of the system (called dynamical models), and some of which use statistics, based on the long record of historical observations.
Model predictions of the SST anomalies in Nino3.4 continue to show the development of an El Niño. As last month, the averages of both the dynamical and statistical models predict an El Niño event right on the weak/moderate borderline of +1.0ºC for the next several months, and then a dip into the weak category for the remainder of the forecast period.
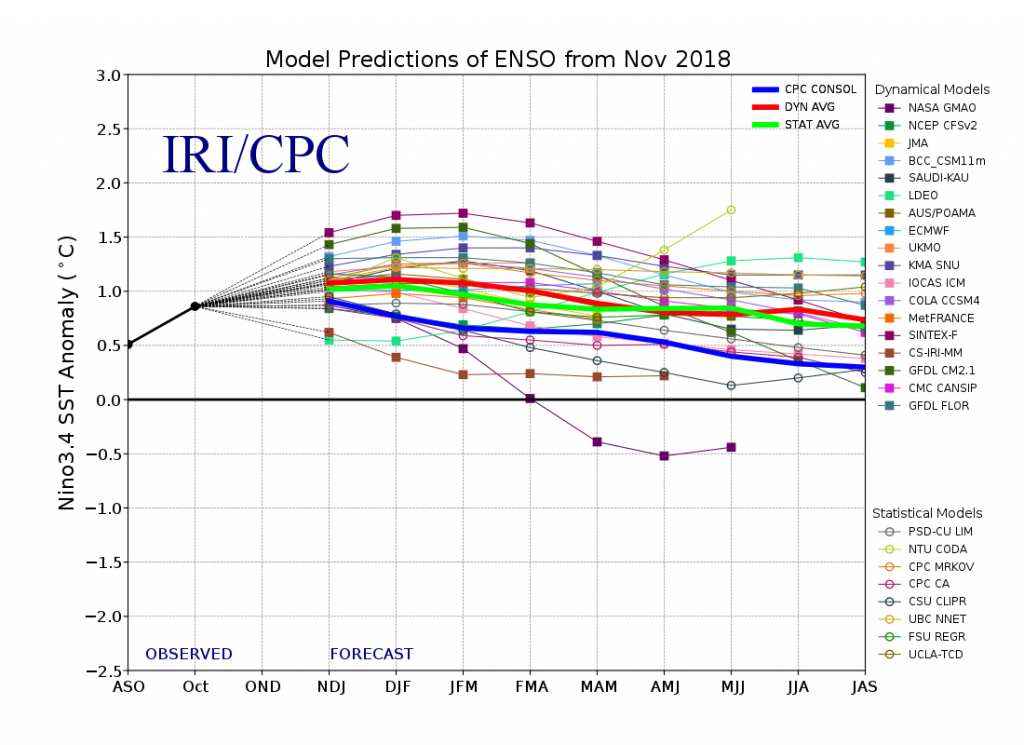
This graph shows forecasts made by dynamical and statistical models for SST in the Nino 3.4 region for nine overlapping 3-month periods. Note that the expected skills of the models, based on historical performance, are not equal to one another.
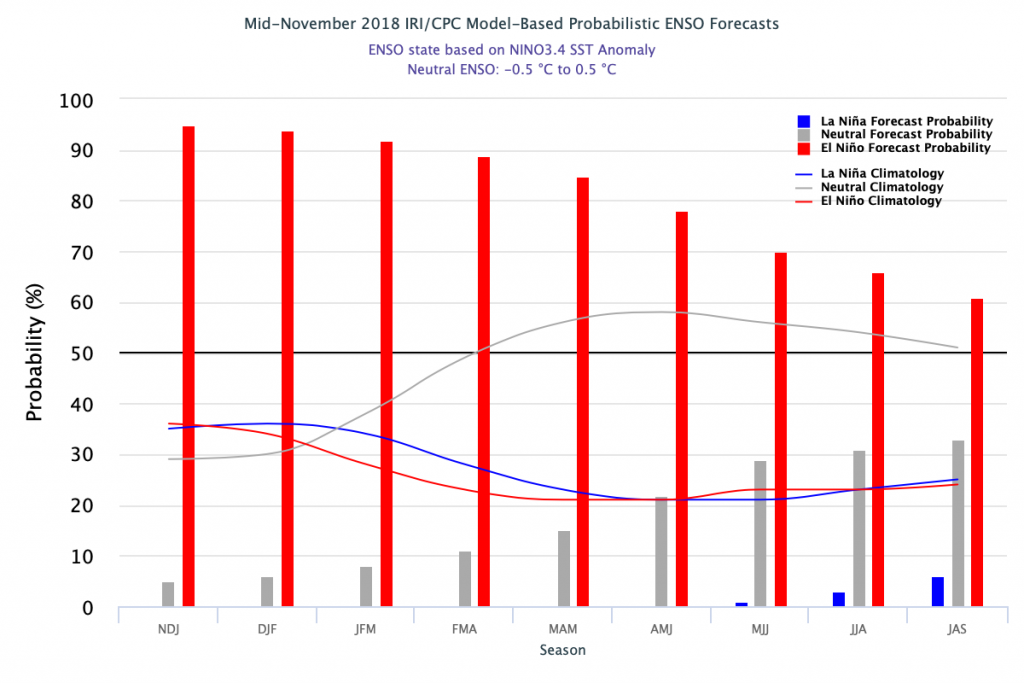
The IRI/CPC probabilistic ENSO forecast issued mid-November 2018. Note that bars indicate likelihood of El Niño occurring, not its potential strength. Unlike the official ENSO forecast issued at the beginning of each month, IRI and CPC issue this updated forecast based solely on model outputs. The official forecast, available at http://1.usa.gov/1j9gA8b, also incorporates human judgement.
Based on the model outputs, odds for El Niño conditions are above 80% through the March – May season. The chances for El Niño conditions are lower in the official probabilistic forecast issued by CPC and IRI in early November than in this mid-month CPC/IRI forecast. This early-November forecast uses human judgement in addition to model output, while the mid-month forecast relies solely on model output. More on the difference between these forecasts in this IRI Medium post.
ENSO in context: Resource page on climate variability
Regarding the ending of the possible El Niño event, the official forecast calls for neutral conditions as the most likely ENSO state beginning in the May – July 2019 season, while odds remain at 70% for El Niño during that season in the models.
IRI’s Global Seasonal Forecasts
Each month, IRI issues seasonal climate forecasts for the entire globe. These forecasts take into account the latest model outputs and indicate which areas are more likely to see above- or below-normal temperatures and precipitation.
Here's a look at seasonal rainfall. We see the expected dry conditions developing in Philippines, Indonesia, western Austrailia, and (eventually) in NE Brazil. We also see expected above-normal precip for southeast South America. #IRIforecast pic.twitter.com/P7TFaRp74l
— IRI (@climatesociety) November 15, 2018
For the upcoming December – February season, odds are strongly tipped in favor of below-normal rainfall across the Philippines, parts of Indonesia and western Australia. The Caribbean, parts of Central America and northern South America have moderately increased odds for below-normal precipitation. Above-normal precipitation is not predicted with as high odds or over as broad areas as below-normal precipitation is predicted, but there are many areas with somewhat enhanced odds for above-normal precipitation.
All forecast maps, including temperature in addition to precipitation, and also including a description of the methodologies, are available on our seasonal forecast page. Additional forecast formats, such as our flexible forecast maproom, are available in the IRI Data Library.
Learn more about El Niño and La Niña on our ENSO resources page, and sign up here to get notified when the next forecast is issued. In the meantime, check out #IRIforecast.
You must be logged in to post a comment.