August Climate Briefing: No Niño or Niña on Horizon
Read our ENSO Essentials & Impacts pages for more about El Niño.
Tony Barnston provides an overview of the briefing
What’s New
Since last month’s briefing, sea-surface temperatures (SSTs) have cooled in the area of the central equatorial Pacific Ocean that define El Niño and La Niña events, called the Nino3.4 region (see first image below). The weekly SST anomalies in the last month have ranged from -0.5ºC to +0.2ºC; their average is on the cool side of a neutral ENSO state.
Atmospheric variables, including tradewinds and convection patterns, also show no signs of a La Niña or El Niño event developing in the coming months. Sub-surface ocean temperatures, another potential signal of upcoming ENSO activity, are now just slightly below average and don’t indicate looming La Niña or El Niño conditions.
The National Oceanic and Atmospheric Administration’s Climate Prediction Center’s ENSO alert system status is currently listed as Not Active.
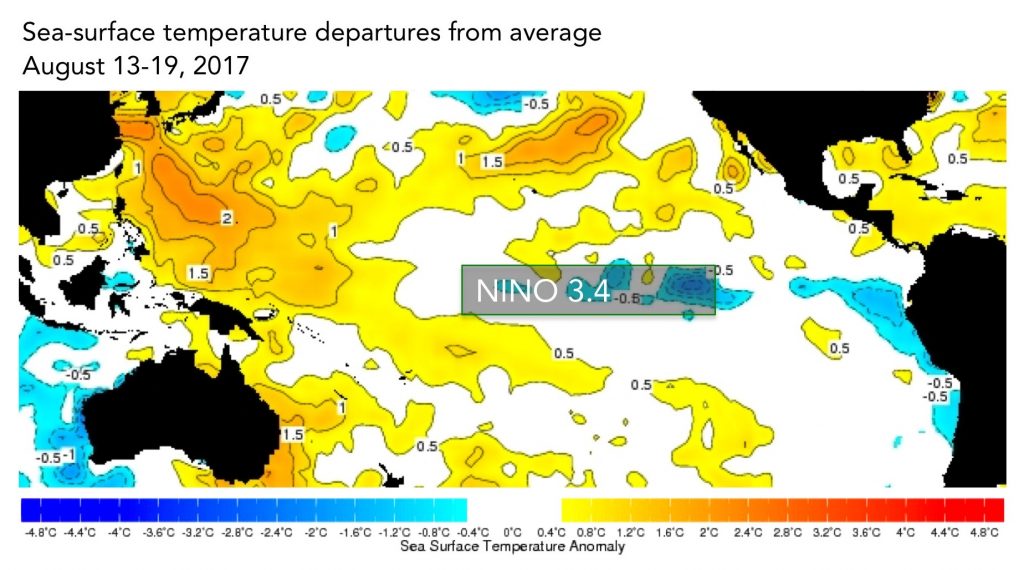
The sea-surface temperatures in the Nino3.4 region (approximated here) serve as a primary metric of El Niño and La Niña conditions. Data from the IRI Data Library. Image: IRI/Elisabeth Gawthrop
ENSO Forecasts
To predict ENSO conditions, computers model the SSTs in the Nino3.4 region over the next several months. The plume graph below shows the outputs of these models, some of which use equations based on our physical understanding of the system (called dynamical models), and some of which use statistics, based on the long record of historical observations.
The SST anomalies indicated by most of the models in last month’s forecast fell in the 0.0ºC to +0.5ºC range for the entire forecast period. Some models went above +0.5ºC, and even fewer dropped below 0.0ºC.
This month, models are split more evenly below and above the 0.0ºC marker, particularly for the period up to the end of 2017. In early 2018, models indicate a bit more warming, but with most still staying below the +0.5ºC El Niño threshold. The dynamical models’ mean especially shows this warming trend, while the statistical models’ mean stays more consistently around +0.1-0.2ºC.
This graph shows forecasts made by dynamical and statistical models for SST in the Nino 3.4 region for nine overlapping 3-month periods. Note that the expected skills of the models, based on historical performance, are not equal to one another.
The IRI/CPC probabilistic ENSO forecast issued mid-August 2017. Note that bars indicate likelihood of El Niño occurring, not its potential strength. Unlike the official ENSO forecast issued at the beginning of each month, IRI and CPC issue this updated forecast based solely on model outputs. The official forecast, available at http://1.usa.gov/1j9gA8b, also incorporates human judgement.
Based on these model outputs, neutral conditions are solidly the most likely ENSO outcome in the coming months, with odds over 50% for the entire forecast period. Odds for La Niña are around 25% or less for the rest of the year, and then drop to around 5% in the new year (see bar graph above). El Niño odds increase to just over 20% to close out 2017 and then increase further to just over 30% at the end of the forecast period.
ENSO in context: Resource page on climate variability
The official probabilistic forecast issued by CPC and IRI in early August indicates a similar overall outlook, the main difference being equal chances of El Niño and La Niña at the end of the forecast period. This early-August forecast uses human judgement in addition to model output, while the mid-month forecast relies solely on model output. More on the difference between these forecasts in this IRI Medium post.
IRI’s global seasonal forecasts
Each month, IRI issues seasonal climate forecasts for the entire globe. These forecasts take into account the latest model outputs and indicate which areas are more likely to see above- or below-normal temperatures and rainfall.
Despite the neutral ENSO forecast, some areas still have a tip of the odds towards drier- or wetter-than-average seasons. For the upcoming September-November season, odds are tipped in favor of above-normal rainfall across much of Indonesia, as well as northeastern Russia. Northeastern South America and parts of southern Africa show the strongest probabilities of increased chances for drier-than-normal conditions. All forecast maps, including temperature in addition to precipitation, are available on our seasonal forecast page.
As of April of this year, these seasonal forecasts use a new methodology. The IRI probabilistic seasonal climate forecast product is now based on a re-calibration of model output from the NOAA’s North American Multi-Model Ensemble Project (NMME). The output from each NMME model is re-calibrated prior to multi-model ensembling to form reliable probability forecasts. The forecasts are now presented on a 1-degree latitude-longitude grid. More on this change on the seasonal forecast page, as well as in this Q&A with three of our climate scientists.
Learn more about El Niño and La Niña on our ENSO resources page, and sign up here to get notified when the next forecast is issued. In the meantime, check out #IRIforecast.
You must be logged in to post a comment.