July Climate Briefing: El Niño Odds Continue Downward Trend
Read our ENSO Essentials & Impacts pages for more about El Niño.
What’s New
Since last month’s briefing, weekly sea-surface temperature anomalies have been similar to the previous month’s temperatures, ranging from +0.5ºC to +0.7ºC in the area of the central equatorial Pacific Ocean that define El Niño and La Niña events, called the Nino3.4 region (see first image below). While these sea-surface temperatures (SSTs) are right at a borderline neutral-weak El Niño ENSO state, these weak anomalies do not equate to an El Niño event. For an El Niño event to occur, atmospheric indicators consistent with El Niño would also be required. Those atmospheric indicators are currently presenting an ENSO-neutral pattern.
New seasonal forecasts: Our precipitation and temperature forecasts have a new methodology. More in this Q&A with our scientists.
While models earlier this year were slightly favoring the development of an El Niño event, beginning last month the odds tipped towards warm but neutral ENSO conditions for the remainder of the year.
The National Oceanic and Atmospheric Administration’s Climate Prediction Center’s ENSO alert system status is currently listed as Not Active.
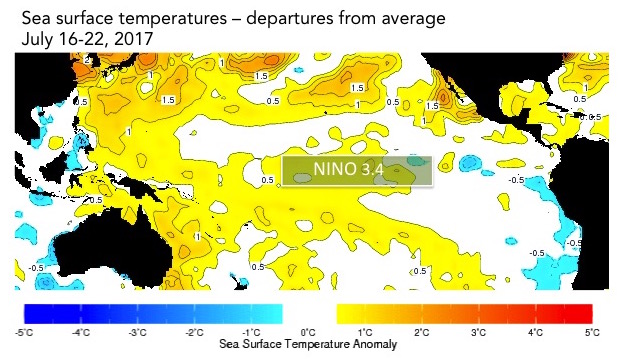
The sea-surface temperatures in the Nino3.4 region (approximated here) serve as a primary metric of El Niño and La Niña conditions. Data from the IRI Data Library. Image: IRI/Elisabeth Gawthrop
ENSO Forecasts
To predict ENSO conditions, computers model the SSTs in the Nino3.4 region over the next several months. The plume graph below shows the outputs of these models, some of which use equations based on our physical understanding of the system (called dynamical models), and some of which use statistics, based on the long record of historical observations.
Despite the fact that SSTs are currently near the El Niño threshold, the model means predict the temperatures will not cross the threshold this year. The dynamical and statistical model predictions are nearly identical to last month’s predictions — they call for Nino3.4 SST anomalies to decrease somewhat and stay between 0.0 and +0.5ºC.
This month is the first that is fully past the spring predictability barrier — a function of ocean dynamics that makes it hard to predict ENSO conditions past June of each year. While climate forecasting is always subject to uncertainty, forecasts issued in July usually carry more certainty than those in the preceding months.
This graph shows forecasts made by dynamical and statistical models for SST in the Nino 3.4 region for nine overlapping 3-month periods. Note that the expected skills of the models, based on historical performance, are not equal to one another.
The IRI/CPC probabilistic ENSO forecast issued mid-July 2017. Note that bars indicate likelihood of El Niño occurring, not its potential strength. Unlike the official ENSO forecast issued at the beginning of each month, IRI and CPC issue this updated forecast based solely on model outputs. The official forecast, available at http://1.usa.gov/1j9gA8b, also incorporates human judgement.
Based on these model outputs, odds for La Niña are around 15% or less for the rest of the year (see bar graph above). Neutral conditions are now the most likely ENSO outcome for the rest of the year.
ENSO in context: Resource page on climate variability
The official probabilistic forecast issued by CPC and IRI in early July also indicates neutral ENSO conditions are the most likely outcome through the remainder of the year. This early-July forecast uses human judgement in addition to model output, while the mid-month forecast relies solely on model output. More on the difference between these forecasts in this IRI Medium post.
Effects of La Niña on global seasonal forecasts
Each month, IRI issues seasonal climate forecasts for the entire globe. These forecasts take into account the latest model outputs and indicate which areas are more likely to see above- or below-normal temperatures and rainfall.
Despite the neutral ENSO forecast, some areas still have a tip of the odds towards drier- or wetter-than-average seasons. For the September-November season, Australia, southwestern Indonesia and parts of South America show the strongest, widespread probabilities of increased chances for drier-than-normal conditions. Some parts of North America, Africa and Asia also show an increased chance for below-average precipitation. All forecast maps, including temperature in addition to precipitation, are available on our seasonal forecast page.
As of April of this year, these seasonal forecasts use a new methodology. The IRI probabilistic seasonal climate forecast product is now based on a re-calibration of model output from the NOAA’s North American Multi-Model Ensemble Project (NMME). The output from each NMME model is re-calibrated prior to multi-model ensembling to form reliable probability forecasts. The forecasts are now presented on a 1-degree latitude-longitude grid. More on this change on the seasonal forecast page, as well as in this Q&A with three of our climate scientists.
Learn more about El Niño and La Niña on our ENSO resources page, and sign up here to get notified when the next forecast is issued. In the meantime, check out #IRIforecast.
You must be logged in to post a comment.