IRI ENSO Forecast
IRI Technical ENSO Update and Model-Based Probabilistic ENSO Forecast
Published: September 19, 2025
Note: The SST anomalies cited below refer to the OISSTv2 SST data set, and not ERSSTv5. OISSTv2 is often used for real-time analysis and model initialization, while ERSSTv5 is used for retrospective official ENSO diagnosis because it is more homogeneous over time, allowing for more accurate comparisons among ENSO events that are years apart. These two products may differ, particularly during ENSO events. The difference between the two datasets may be as much as 0.5 °C. Additionally in some years, the ERSSTv5 may tend to be cooler than OISSTv2 in the context of warming trends, because ERSSTv5 is expressed relative to a base period that is updated every 5 years, while the base period of OISSTv2 is updated every 10 years. In February 2021, both datasets were updated to reflect the 1991-2020 climatology period.
Recent and Current Conditions
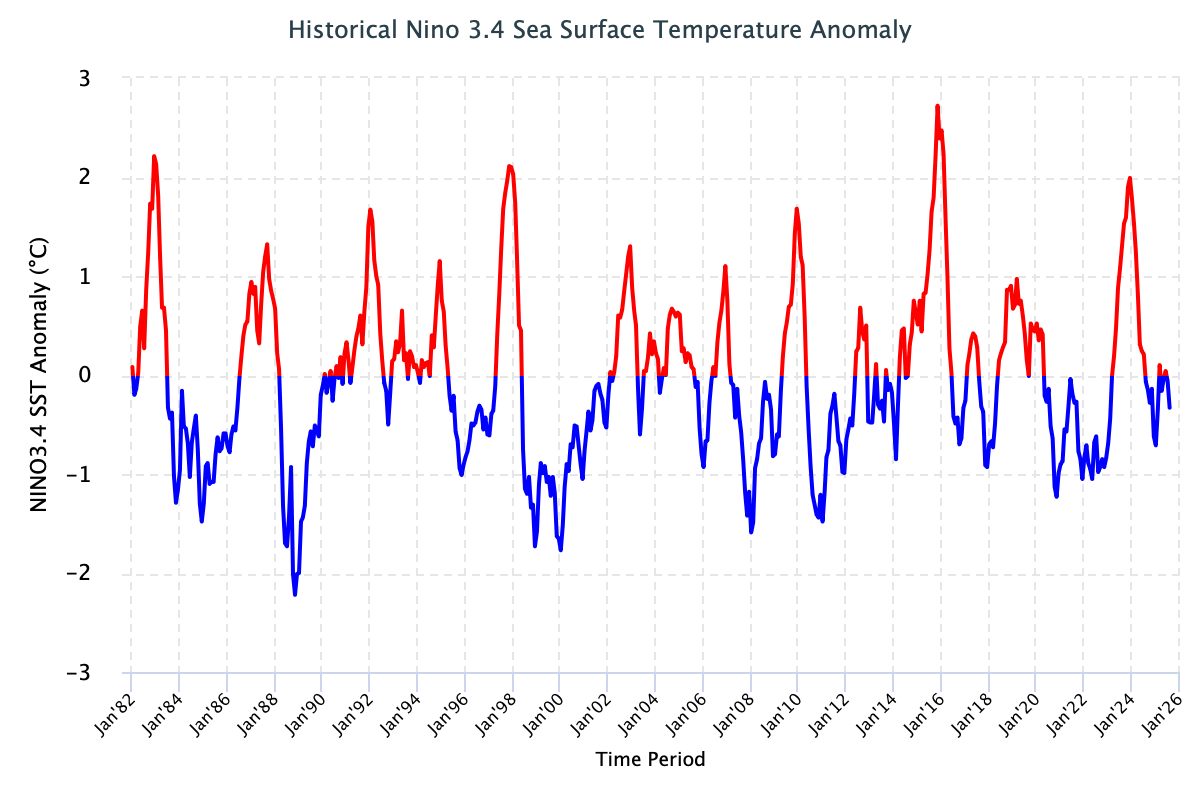
The SST anomaly in the NINO3.4 region during the Jun–Aug 2025 season was -0.12 °C, and for August, it was -0.33 °C. The most recent weekly average (week centered on September 10, 2025) of the NINO3.4 index was -0.5 °C. While these values remain within the ENSO-neutral range, they reflect a clear cooling trend, indicating that cold conditions are gradually developing in the tropical Pacific Ocean. The IRI’s definition of El Niño, similar to NOAA/Climate Prediction Center’s, requires that the monthly SST anomaly in the NINO3.4 region (5°S-5°N; 170°W-120°W) exceed +0.5 °C. Similarly, for La Niña, the anomaly must be -0.5 °C or colder.
As of mid-September 2025, both atmospheric and oceanic indicators continue to show ENSO-neutral conditions; however, there are indications that the tropical Pacific may evolve towards weak La Niña conditions in the coming months. The traditional and equatorial Southern Oscillation Index (SOI) for August 2025 was +2.1 and +0.9 respectively, falling within the ENSO-neutral ranges. Low-level (850-hPa) wind anomalies were easterly across the east-central and eastern Pacific. Upper-level (200-hPa) wind anomalies were westerly over the eastern equatorial Pacific. Below-average OLR, indicating enhanced convection and increased precipitation, was observed over parts of Indonesia, while above-average OLR, associated with suppressed convection and reduced precipitation, was present over and around the Date Line. Over the past few months, below-average sea surface temperatures have gradually intensified in the east-central and eastern Pacific. These anomalies have continued to strengthen, supported by enhanced trade winds across the equatorial Pacific. If this cooling trend persists, it may signal the onset of La Niña conditions in the coming months. Meanwhile, above-average subsurface temperatures have persisted in the western Pacific, reflecting the ongoing east–west subsurface temperature gradient across the equatorial ocean. Overall, current conditions continue to reflect an ENSO-neutral state; however, gradual changes in both the ocean and atmosphere are emerging, indicating the potential development of La Niña conditions in the coming months.
Expected Conditions
Note – Only models that produce a new ENSO prediction every month are considered in this statement.
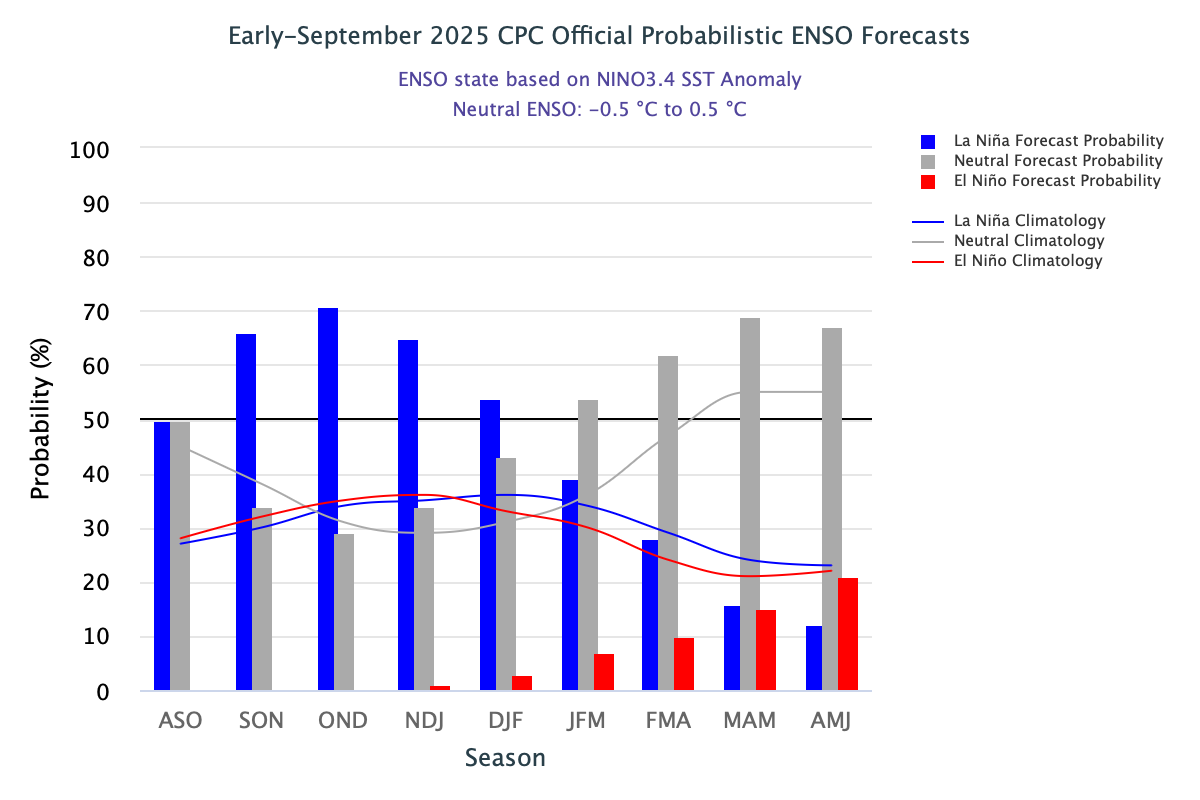
The El Niño/Southern Oscillation (ENSO) Diagnostic Discussion released on 11 September 2025 by the Climate Prediction Center (CPC)/NCEP/NWS, maintained a “La Niña Watch,” forecasting that a transition from ENSO-neutral to La Niña conditions is likely in the next couple of months, with a 71% chance of La Niña during October–December 2025. Thereafter, La Niña remains favored, although the probability decreases to 54% for the December 2025–February 2026 period.
The latest set of ENSO prediction models from mid-September 2025 is now available in the IRI ENSO prediction plume. These are used to assess the probabilities of the three ENSO categories by using the average value of the NINO3.4 SST anomaly predictions from all models in the plume, equally weighted. A standard Gaussian error is imposed over that averaged forecast, with its width determined by an estimate of overall expected model skill for the season of the year and the lead time. Higher skill results in a relatively narrower error distribution, while low skill results in an error distribution with width approaching that of the historical observed distribution.
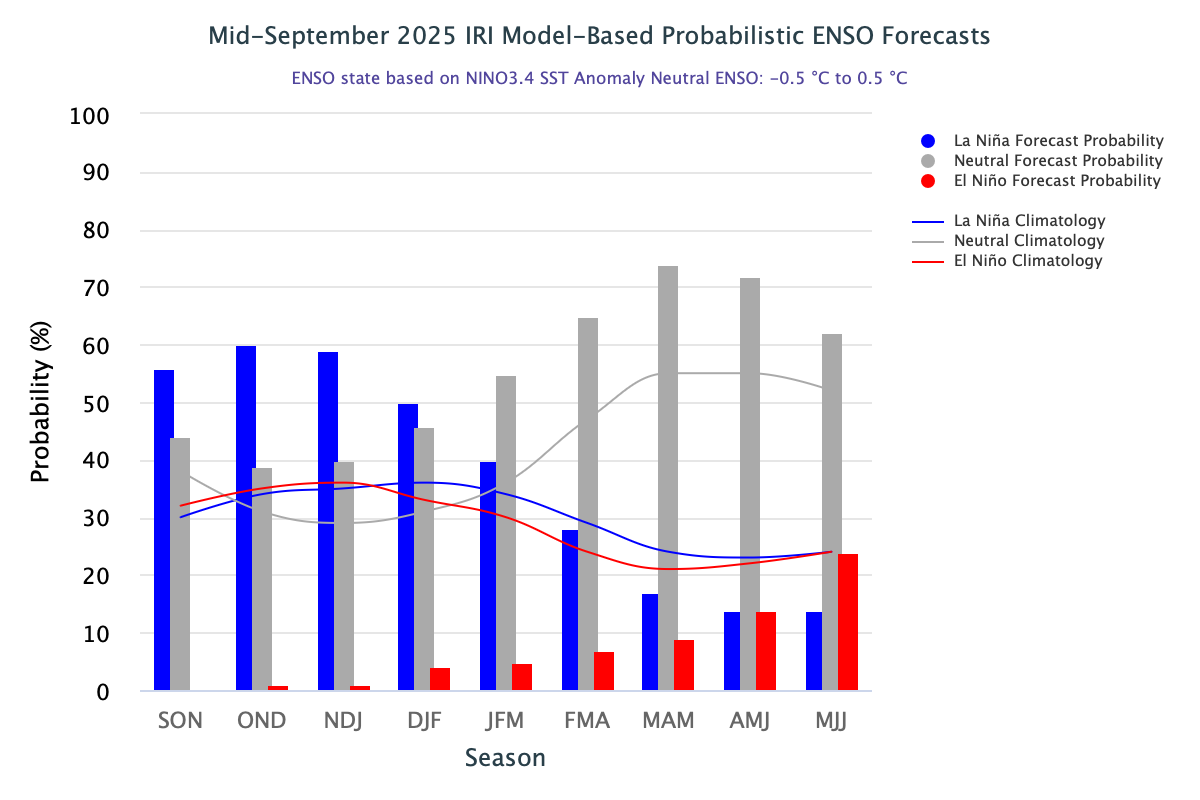
According to the ENSO plume forecast issued by the IRI in September 2025, there is a moderate probability (56%) of La Niña conditions developing during September–November 2025, while the likelihood of ENSO-neutral conditions continuing is estimated at around 44%. For the overlapping seasonal periods of October–December, November–January, and December–February, the forecast probabilities for La Niña are 60%, 59%, and 50%, respectively. In contrast, the likelihood of ENSO-neutral conditions during these periods is 39%, 40%, and 46%. These predictions suggest a higher probability of La Niña developing through late 2025, although confidence decreases slightly as the forecast extends into early 2026. Subsequently, the probability of ENSO-neutral conditions gradually becomes dominant again—rising from 55% in January–March to 65% in February–April, 74% in March–May, 72% in April–June, and 62% in May–July 2026. During the same period, the chances of La Niña are estimated to decrease from 40% to 14%. The probability of El Niño development remains below 10% through the boreal spring of 2026, but increases slightly to 14% and 24% during April–June and May–July 2026, respectively. A plot of the probabilities summarizes the forecast evolution. The climatological probabilities for La Niña, ENSO-neutral, and El Niño conditions vary seasonally, and are shown by the lines on the plot, and are given in a table at the bottom of this page for each 3-month season.
Caution is advised in interpreting the forecast distribution from the Gaussian standard error as the actual probabilities, due to differing biases and performance of the different models. In particular, this approach considers only the mean of the predictions, and not the total range across the models, nor the ensemble range within individual models. At longer leads, the skill of the models degrades, and uncertainty in skill must be convolved with the uncertainties from initial conditions and differing model physics, which leads to more climatological probabilities in the long-lead ENSO Outlook than might be suggested by the suite of models. Furthermore, the expected skill of one model versus another has not been established using uniform validation procedures, which may cause a difference in the true probability distribution.
It is worth noting that the Relative Oceanic Niño Index, which measures sea surface temperature anomalies in the eastern equatorial Pacific relative to the rest of the equatorial band, has exceeded the -0.5 La Niña threshold for the past several overlapping seasons (with values of -0.50 for Jun–Aug 2024, -0.63 for Jul–Sep, -0.75 for Aug–Oct, -0.81 for Sep–Nov, -0.92 for Oct–Dec, -1.07 for Nov–Jan, -1.12 for Dec–Feb, -0.89 for Jan–Mar 2025, -0.67 for Feb–Apr, -0.53 for Mar–May, and -0.49 for Apr–Jun 2025); however, it has returned to ENSO-neutral values (-0.40 for May–Jul, and -0.46 for Jun-Aug, 2025). The Pacific Decadal Oscillation Index in August 2025 recorded a value of -3.23, following its record-breaking value of -4.12 in July 2025.
A caution regarding the model-based ENSO plume predictions (released mid-month) is that factors such as known specific model biases and recent changes in the tropical Pacific that the models may have missed, are not considered. This approach is purely objective. Those issues are taken into account in CPC’s official outlooks, which are issued early in the month, and which will include some human judgment in combination with the model guidance.