CCSR/IRI ENSO Forecast
CCSR/IRI Technical ENSO Update and Model-Based Probabilistic ENSO Forecast
Published: May 19, 2025
Note: The SST anomalies cited below refer to the OISSTv2 SST data set, and not ERSSTv5. OISSTv2 is often used for real-time analysis and model initialization, while ERSSTv5 is used for retrospective official ENSO diagnosis because it is more homogeneous over time, allowing for more accurate comparisons among ENSO events that are years apart. These two products may differ, particularly during ENSO events. The difference between the two datasets may be as much as 0.5 °C. Additionally in some years, the ERSSTv5 may tend to be cooler than OISSTv2 in the context of warming trends, because ERSSTv5 is expressed relative to a base period that is updated every 5 years, while the base period of OISSTv2 is updated every 10 years. In February 2021, both datasets were updated to reflect the 1991-2020 climatology period.
Recent and Current Conditions
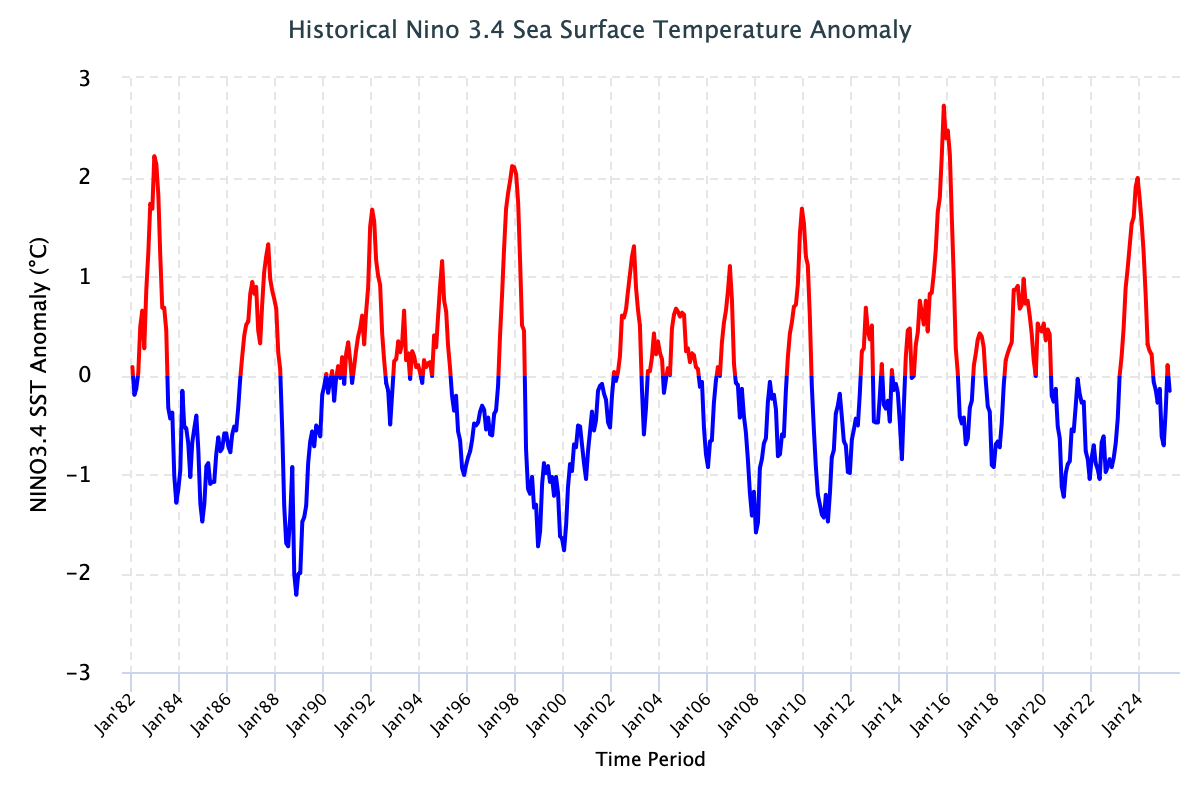
The SST anomaly in the NINO3.4 region during the Feb-Apr 2025 season was -0.14 °C, and for April 2025, it was -0.16 °C. The most recent weekly average (week centered on May 14, 2025) of the NINO3.4 index was -0.10 °C. The latest seasonal, monthly, and weekly values suggest that the tropical Pacific has been experiencing ENSO-neutral conditions. The IRI’s definition of El Niño, similar to NOAA/Climate Prediction Center’s, requires that the monthly SST anomaly in the NINO3.4 region (5°S-5°N; 170°W-120°W) exceed +0.5 °C. Similarly, for La Niña, the anomaly must be -0.5 °C or colder.
As of mid-May 2025, both atmospheric and oceanic indicators continue to show ENSO-neutral conditions. For instance, the traditional and equatorial Southern Oscillation Index (SOI) for April 2025 was +3.6 and +0.3 respectively, falling within the ENSO-neutral ranges. The trade winds (at 850 hPa) were normal in the equatorial central-western Pacific but weaker than normal in the eastern Pacific during April 2025. The upper-level winds (at 200 hPa) are close to average over the equatorial Pacific. Atmospheric convection over the central Pacific is also normal, consistent with typical ENSO-neutral conditions. Since April 2025, subsurface temperatures from the International Date Line to 80°W (covering the central to eastern Pacific) have stayed close to average, while deeper waters from the western Pacific to the Date Line remain warmer. This pattern shows there is no distinct subsurface signal in the central-eastern Pacific, aligning with the current ENSO-neutral state. Therefore, together, these observed conditions in the coupled ocean-atmosphere system indicate ENSO-neutral conditions in the equatorial Pacific.
Expected Conditions:
Note – Only models that produce a new ENSO prediction every month are considered in this statement.
What is the outlook for the ENSO status going forward?
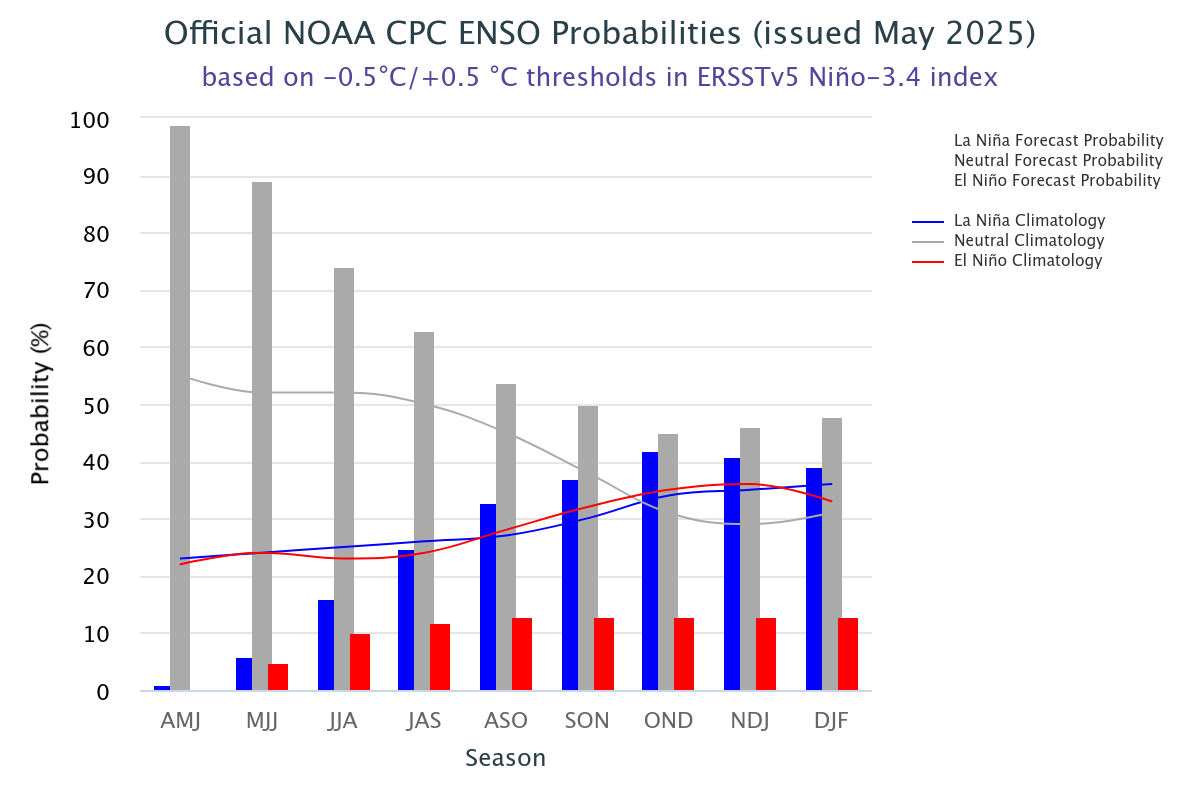
The El Niño/Southern Oscillation (ENSO) Diagnostic Discussion released on 8 May 2025 by the Climate Prediction Center/NCEP/NWS issued “Not Active” ENSO state, and forecasted the ENSO-neutral conditions with 74% chances during the Northern Hemisphere summer (June-August).
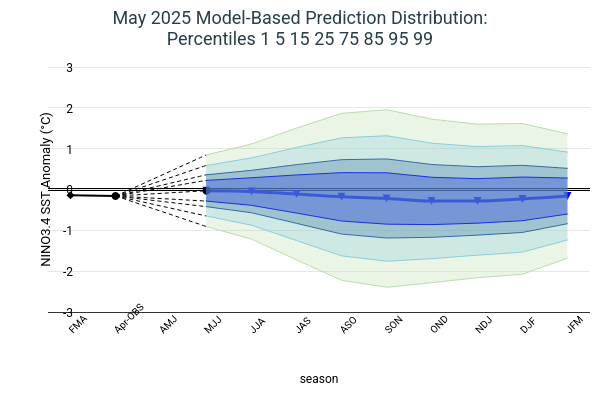
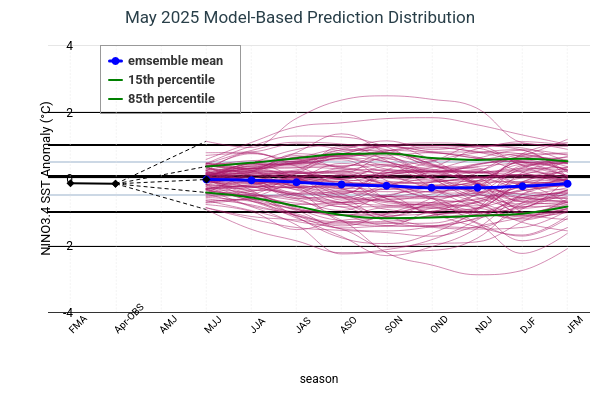
The latest set of ENSO prediction models from mid-May 2025 is now available in the IRI ENSO prediction plume. These are used to assess the probabilities of the three ENSO categories by using the average value of the NINO3.4 SST anomaly predictions from all models in the plume, equally weighted. A standard Gaussian error is imposed over that averaged forecast, with its width determined by an estimate of overall expected model skill for the season of the year and the lead time. Higher skill results in a relatively narrower error distribution, while low skill results in an error distribution with width approaching that of the historical observed distribution.
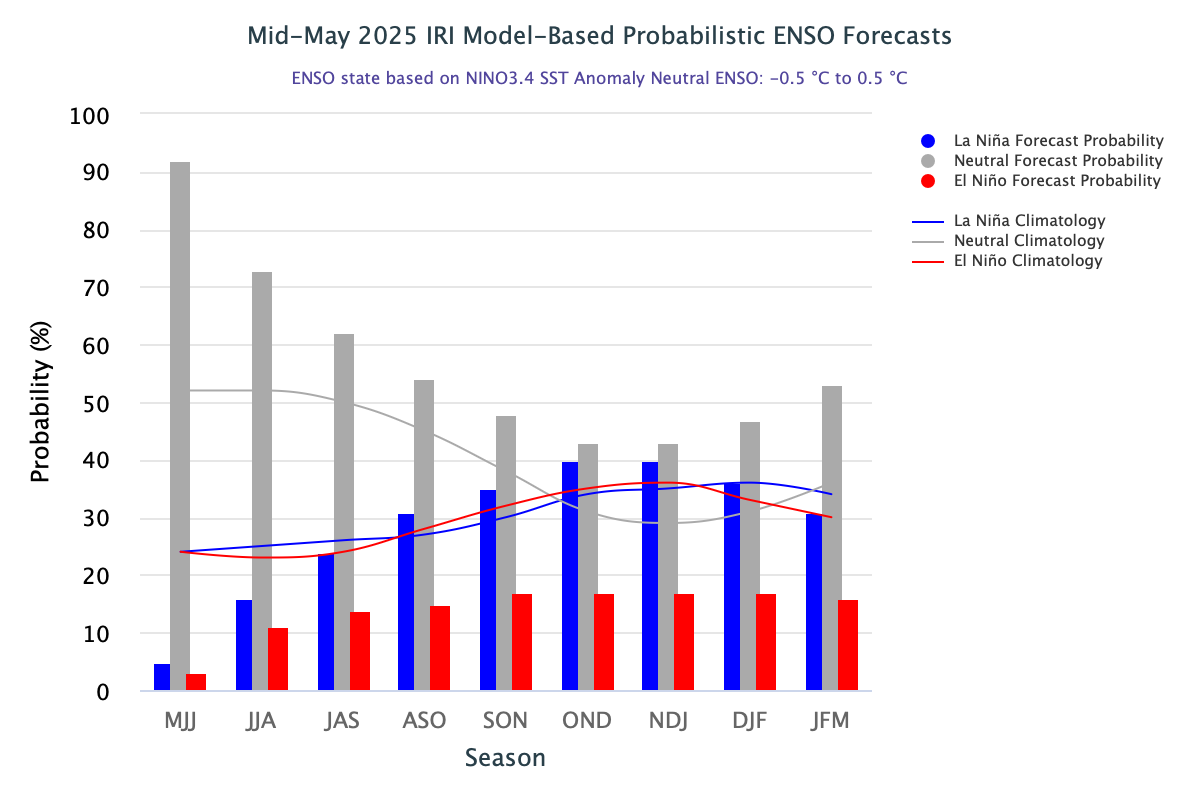
According to the ENSO forecast issued by the IRI in May 2025, there is a high probability (92%) of ENSO-neutral conditions continuing during May–Jul 2025, while the chances for La Niña and El Niño are only 5% and 3%, respectively. For the periods Jun-Aug, Jul-Sep, and Aug–Oct, ENSO-neutral conditions remain favored at 73%, 62%, and 54% respectively. The probability of La Niña gradually increases from 16% to 31% during the same period, while the probability for El Niño ranges from 11% to 15%. For Sep–Nov 2025 to Jan–Mar 2026, ENSO-neutral conditions still have the highest probability, with values between 48% and 53%. During this same period, the probabilities for El Niño and La Niña range from 16% to 40%. After the Northern Hemisphere summer, the odds may shift toward either El Niño or La Niña, depending on how conditions evolve in the coming months. Currently, the likelihood is tilted more toward La Niña than El Niño, but there is considerable uncertainty in these predictions since the forecast is being made during the spring predictability barrier. A plot of the probabilities summarizes the forecast evolution. The climatological probabilities for La Niña, ENSO-neutral, and El Niño conditions vary seasonally, and are shown by the lines on the plot, and are given in a table at the bottom of this page for each 3-month season.
Caution is advised in interpreting the forecast distribution from the Gaussian standard error as the actual probabilities, due to differing biases and performance of the different models. In particular, this approach considers only the mean of the predictions, and not the total range across the models, nor the ensemble range within individual models. At longer leads, the skill of the models degrades, and uncertainty in skill must be convolved with the uncertainties from initial conditions and differing model physics, which leads to more climatological probabilities in the long-lead ENSO Outlook than might be suggested by the suite of models. Furthermore, the expected skill of one model versus another has not been established using uniform validation procedures, which may cause a difference in the true probability distribution.
In summary, the forecast indicates a high probability of ENSO-neutral conditions for May–Jul 2025, with these conditions expected to persist until Aug–Oct 2025. It is worth noting that the Relative Oceanic Niño Index (RONI: https://www.cpc.ncep.noaa.gov/data/indices/RONI.ascii.txt), which measures sea surface temperature anomalies in the Niño 3.4 region (5°N–5°S, 120°W–170°W) relative to the rest of the equatorial band, has remained below the -0.5 La Niña threshold for the past seven overlapping seasons (-0.50 for Jun-Aug, -0.63 for Jul-Sep, -0.75 for Aug-Oct, -0.81 for Sep-Nov 2024, -0.92 for Oct-Dec, -1.07 for Nov-Jan, -1.12 for Dec-Feb, -0.90 for Jan-Mar, 2025, and -0.68 for Feb-Apr, 2025). The Multivariate ENSO-Index (MEI: https://psl.noaa.gov/enso/mei/), which accounts for both oceanic and atmospheric conditions, registered -0.4°C during Mar-Apr 2025, which is ENSO-neutral range.
A caution regarding the model-based ENSO plume predictions (released mid-month) is that factors such as known specific model biases and recent changes in the tropical Pacific the models may have missed, are not considered. This approach is purely objective. Those issues are taken into account in CPC’s official outlooks, which are issued early in the month, and which will include some human judgment in combination with the model guidance.