February 2014 Climate Briefing: Kelvin Waves Signal Potential El Niño
From February’s climate briefing, given by our Tony Barnston:
The central and eastern Pacific Ocean is currently experiencing borderline La Niña conditions, but many models are forecasting an El Niño to develop this (northern hemisphere) summer. Although scientists still don’t know the exact mechanism behind the Pacific’s transition from one state of the El Niño Southern Oscillation (ENSO) to another, both statistical and dynamical models are predicting about a 45% chance for El Niño conditions six months from now.
So how are these forecasts made?
IRI scientists define current ENSO conditions using the Niño3.4 index — a measure of sea-surface temperatures (SSTs) in a specific region in the equatorial Pacific Ocean that indicates whether ENSO is in a warm (El Niño), cool (La Niña), or neutral phase. An index value equal or greater than +0.5 means sea-surface temperatures are above average, and the Pacific is said to be in an El Niño state. If the index reaches or falls below -0.5, the Pacific is in a La Niña state. For much of last fall and this winter, the Pacific stayed in a neutral state. The index average for January and early February crept down to -0.51—just barely La Niña conditions—but recent sea-surface warming pushed it back up into the neutral category. Warmer-than-average water temperatures are also developing beneath the surface of the tropical Pacific, an early indication that El Niño might be ahead.
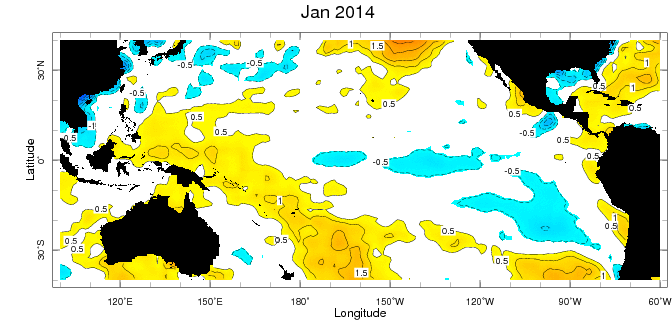
This map displays monthly departures from average sea- surface temperature for the Pacific Ocean in January 2014. Yellow to red colors on the map indicate areas where sea-surface temperatures were above the January average, and blue shades indicate where they were below normal. Shading starts at +/- 0.5°C. The pattern for January 2014 indicates an ENSO state on the border of neutral and La Niña conditions. More in our map room.
Consistent with this development, a Kelvin wave is currently moving eastward across the Pacific, triggered by westerly surface winds in the western Pacific last month. The wave will reach the coast of South America in a few months. Kelvin waves, which are 100-200 meters below the sea surface and hundreds of kilometers wide, make water warmer as they travel (learn more about Kelvin waves here).
“If the sea-surface temperatures in the far eastern tropical Pacific warm up enough in response to the Kelvin wave, westerly wind anomalies could develop in the central and eastern part of the ocean, and this, in turn, could result in further warming of the surface waters—a feedback cycle that is the hallmark of an El Niño episode,” explained Barnston.
To predict future ENSO conditions, IRI scientists use two types of models. Dynamical models are based on physical equations and use current oceanic and atmospheric conditions as a starting point. Statistical models, on the other hand, use the statistical relationships found in long historical records of ocean observations, to predict how current ocean temperature patterns might be expected to change.
At present, the dynamical models are showing a stronger chance of an El Niño this summer than the statistical models. Barnston said this is due in part to the inability of many of the statistical models to detect the Kelvin wave because they use only temperatures at the sea surface and not at the depths in which Kelvin waves travel. The current IRI forecast uses a mix of statistical and dynamical models and calls for near-equal chances (~45%) this summer for neutral conditions and El Niño conditions. There is about a 10% likelihood for La Niña conditions.
“We have not had an El Niño since the one that developed in 2009—five years ago. Although four years without an El Niño has happened previously, longer gaps are not common and from that point of view, we are due for another event,” said Barnston. “However, the number of years since the last El Niño in itself is not a good predictor. The accumulation of above-average temperatures in the subsurface waters is a more physically meaningful predictor, and that situation has been developing in association with the current Kelvin wave,” he said.
View the full ENSO and seasonal climate forecasts on our site: http://iri.columbia.edu/our-expertise/climate/forecasts/
Additional Resources
– Visit our IFRC Map Room to see typical rainfall during El Niño and La Niña events.
– Can we blame El Niño? Learn more about ENSO and how it affects society.
– Delve deeper and read Barnston’s 2012 BAMS paper, “Skill of Real-Time Seasonal ENSO Model Predictions during 2002–11: Is Our Capability Increasing?”
You must be logged in to post a comment.