ENSO Forecast Navigation

ENSO Forecasts

ENSO Forecast

July 2021 Quick Look

Published: July 8, 2021

A monthly summary of the status of El Niño, La Niña, and the Southern Oscillation, or ENSO, based on the NINO3.4 index (120-170W, 5S-5N)

In mid-July, SSTs in the east-central Pacific are -0.1 degree C different from average. The evolution of some key atmospheric variables is consistent with ENSO-neutral conditions, but others may hint at cooling to come. A large majority of the model forecasts predict SSTs to remain near-normal through boreal summer, and about half of the dynamical models predict near-normal throughout the full forecast period. Similar to the new official CPC/IRI outlook issued earlier this month, this objective outlook calls for ENSO-neutral to persist through at least Aug-Sep-Oct, with greater uncertainty later in the year.

Figures 1 and 3 (the official CPC ENSO probability forecast and the objective model-based IRI ENSO probability forecast, respectively) are often quite similar. However, occasionally they may differ noticeably. There can be several reasons for differences. One possible reason is that the human forecasters, using their experience and judgment, may disagree to some degree with the models, which may have known biases. Another reason is related to the fact that the models are not run at the same time that the forecasters make their assessment, so that the starting ENSO conditions may be slightly different between the two times. The charts on this Quick Look page are updated at two different times of the month, so that between the second and the third Thursday of the month, the official forecast (Fig. 1) has just been updated, while the model-based forecasts (Figs. 3 and 4) are still from the third Thursday of the previous month. On the other hand, from the third Thursday of the month until the second Thursday of the next month, the model-based forecasts are more recently updated, while the official forecasts remain from the second Thursday of the current month.
Click on the for more information on each figure.

Historically Speaking

    El Niño and La Niña events tend to develop during the period Apr-Jun and they
  • Tend to reach their maximum strength during October - February
  • Typically persist for 9-12 months, though occasionally persisting for up to 2 years
  • Typically recur every 2 to 7 years

ENSO Forecast

CPC ENSO Update

Published: July 8, 2021

El Niño/Southern Oscillation (ENSO) Diagnostic Discussion issued by the Climate Prediction Center/NCEP/NWS

ENSO Alert System Status: La Niña Watch

Synopsis: ENSO-neutral is favored through the Northern Hemisphere summer and into the fall (51% chance for the August-October season), with La Niña potentially emerging during the September-November season and lasting through the 2021-22 winter (66% chance during November-January). 

Near-average sea surface temperatures, consistent with ENSO-neutral conditions, were observed across most of the equatorial Pacific Ocean during June (Fig. 1). In the last week, most Niño indices were near zero except for the Niño-1+2 index, which was +0.3ºC (Fig. 2). Subsurface temperature anomalies were slightly positive (averaged from 180-100ºW) and remained steady during the month (Fig. 3). However, in parts of the eastern Pacific, below-average subsurface temperature anomalies returned near the thermocline (Fig. 4). For the month, the low-level and upper-level winds were near average across most of the equatorial Pacific Ocean.  Tropical convection was suppressed near the Date Line, while remaining mostly near average elsewhere (Fig. 5). Overall, the ocean and atmosphere system reflected ENSO-neutral conditions.

A majority of the models in the IRI/CPC plume predict ENSO-neutral to continue through the fall and winter 2021-22 (Fig. 6). However, the latest forecast model runs from the NCEP CFSv2, many of the models from the North American Multi-Model Ensemble, and some models from our international partners indicate the onset of La Niña during the Northern Hemisphere fall, continuing into winter 2021-22.  The forecaster consensus favors these model ensembles, while also noting the historical tendency for a second winter of La Niña to follow the first.  In summary, ENSO-neutral is favored through the Northern Hemisphere summer and into the fall (51% chance for the August-October season), with La Niña potentially emerging during the September-November season and lasting through the 2021-22 winter (66% chance during November-January; click CPC/IRI consensus forecast for the chances in each 3-month period).

This discussion is a consolidated effort of the National Oceanic and Atmospheric Administration (NOAA), NOAA’s National Weather Service, and their funded institutions. Oceanic and atmospheric conditions are updated weekly on the Climate Prediction Center web site (El Niño/La Niña Current Conditions and Expert Discussions). Additional perspectives and analysis are also available in an ENSO blog.  A probabilistic strength forecast is available here.

The next ENSO Diagnostics Discussion is scheduled for 12 Aug 2021. To receive an e-mail notification when the monthly ENSO Diagnostic Discussions are released, please send an e-mail message to: ncep.list.enso-update@noaa.gov.


CPC/IRI Official Probabilistic ENSO Forecasts

Season La Niña Neutral El Niño
JJA 17 82 1
JAS 32 64 4
ASO 45 51 4
SON 55 42 3
OND 62 35 3
NDJ 66 31 3
DJF 60 36 4
JFM 54 42 4
FMA 47 49 4

IRI ENSO Forecast

IRI Technical ENSO Update

Published: July 19, 2021

Note: The SST anomalies cited below refer to the OISSTv2 SST data set, and not ERSSTv5. OISSTv2 is often used for real-time analysis and model initialization, while ERSSTv5 is used for retrospective official ENSO diagnosis because it is more homogeneous over time, allowing for more accurate comparisons among ENSO events that are years apart. During ENSO events, OISSTv2 often shows stronger anomalies than ERSSTv5, and during very strong events the two datasets may differ by as much as 0.5 C. Additionally, the ERSSTv5 may tend to be cooler than OISSTv2, because ERSSTv5 is expressed relative to a base period that is updated every 5 years, while the base period of OISSTv2 is updated every 10 years and so, half of the time, is based on a slightly older period and does not account as much for the slow warming trend in the tropical Pacific SST. In February 2021, both datasets were updated using the 1991-2020 climatology period.

Recent and Current Conditions

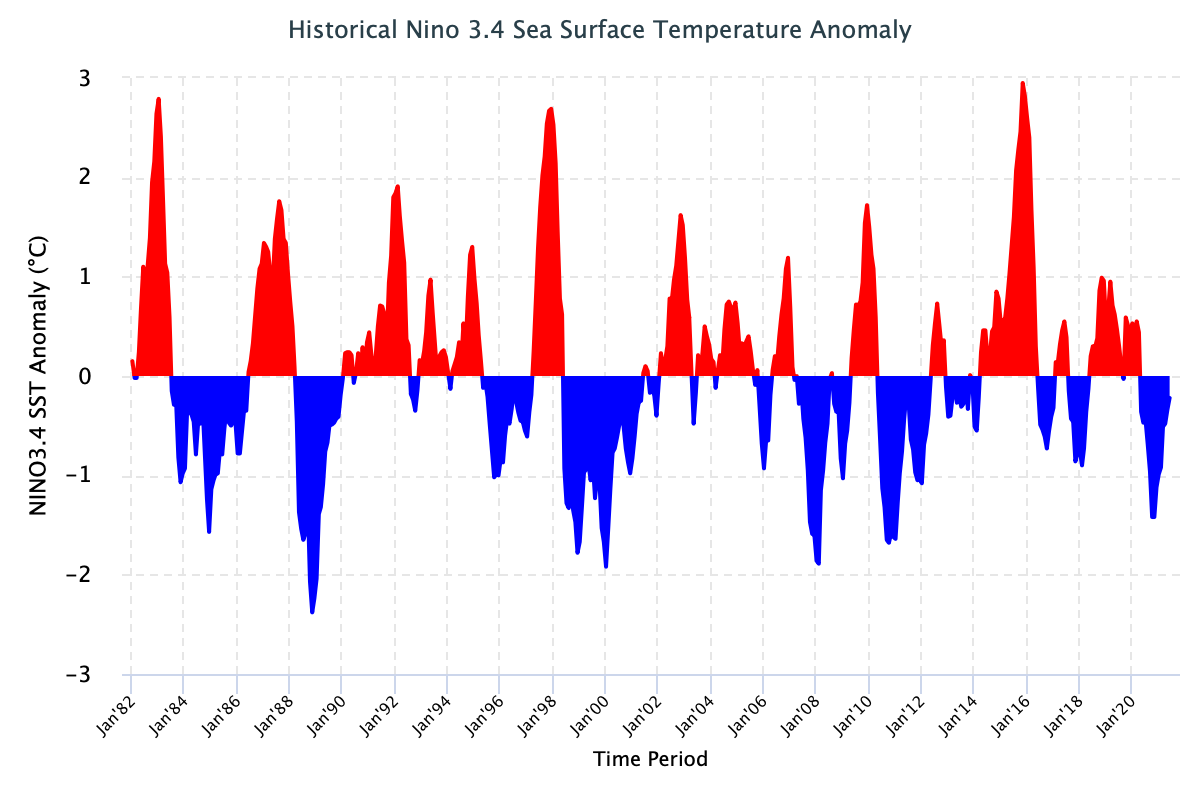
As of mid-July 2021, SSTs have been at the long-term average in the NINO3.4 region for the past several weeks, following the recent La Niña event in the tropical Pacific. The SST anomaly for NINO3.4 during the Apr-Jun season was -0.35 C, and for the month of June it was -0.22 C, both of which suggest ENSO neutral conditions. The IRI’s definition of El Niño, like NOAA/Climate Prediction Center’s, requires that the SST anomaly in the NINO3.4 region (5S-5N; 170W-120W) exceed 0.5 C. Similarly, for La Niña, the anomaly must be -0.5 C or less. The climatological probabilities for La Niña, neutral, and El Niño conditions vary seasonally, and are shown in a table at the bottom of this page for each 3-month season. The most recent weekly anomaly in the NINO3.4 region was -0.1 C, which is clearly ENSO-neutral. Some of the key atmospheric variables are also consistent with ENSO-neutral conditions. Anomalously wet conditions that were seen over the Maritime Continent during the La Niña event have been replaced by dry anomalies, which seem to dominate the tropical Pacific region at this time. Other key atmospheric variables are again beginning to show some hint of equatorial Pacific cooling. The traditional and equatorial Southern Oscillation Indices have increased in recent weeks to levels outside neutral, similar to values seen during mild La Niña conditions. The Trade Wind anomalies near the surface are beginning to increase again, though they are weak and currently exist mainly in the central and western Pacific. The upper-level, westerly wind anomalies that would accompany a large-scale response to La Niña conditions are not visible, suggesting the low-level winds are currently not part of a basin-wide impact on the Walker Circulation. For the sub-surface equatorial ocean, warm temperature anomalies in the mixed layer and upper thermocline overlie cool temperature anomalies in the lower thermocline, suggesting a tighter, more stratified thermocline region. In summary, the equatorial Pacific region is now in ENSO-neutral conditions, but some elements of the large-scale climate are consistent with the development of cooler than normal sea surface temperatures. CPC announced the end of the 2020-21 La Niña on May 13, 2021, but issued a new La Niña watch for potential re-emergence of La Niña conditions during Sep-Nov on July 8, 2021.

Expected Conditions

Note – Only models that produce a new ENSO prediction every month are considered in this statement.

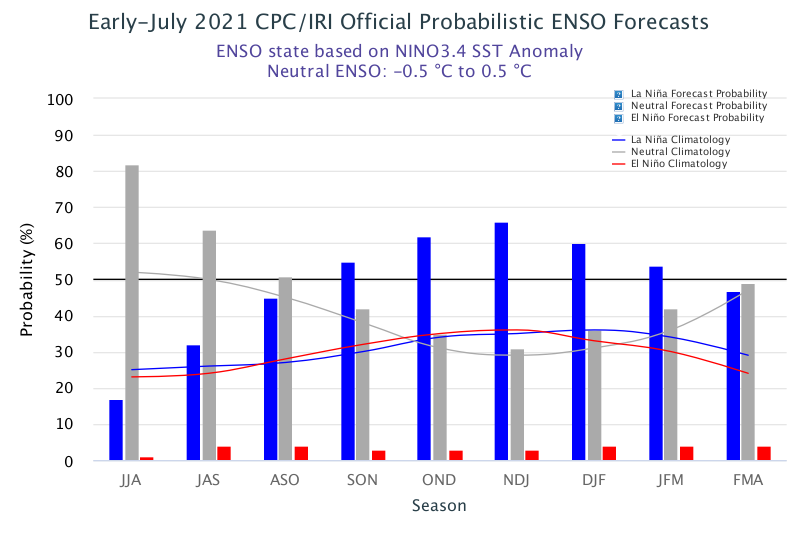
What is the outlook for the ENSO status going forward? The most recent official diagnosis and outlook was issued approximately one week ago in the NOAA/Climate Prediction Center ENSO Diagnostic Discussion, produced jointly by CPC and IRI; it states that ENSO-neutral is favored at least through the Northern Hemisphere summer and into the fall (51% chance for the August-October season).

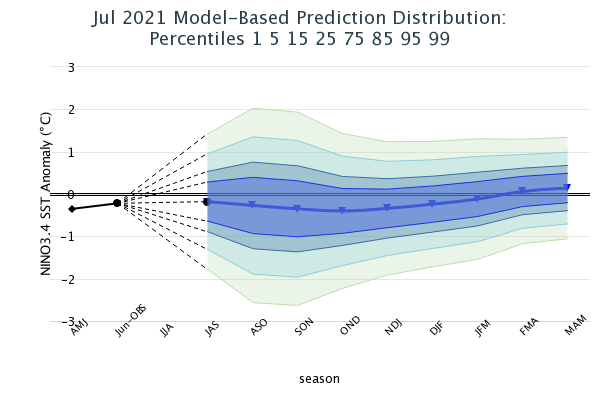
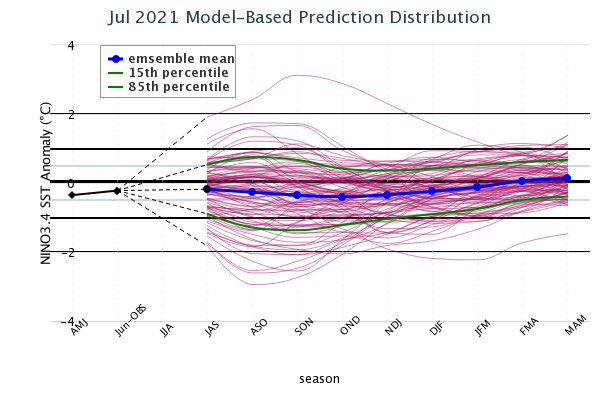
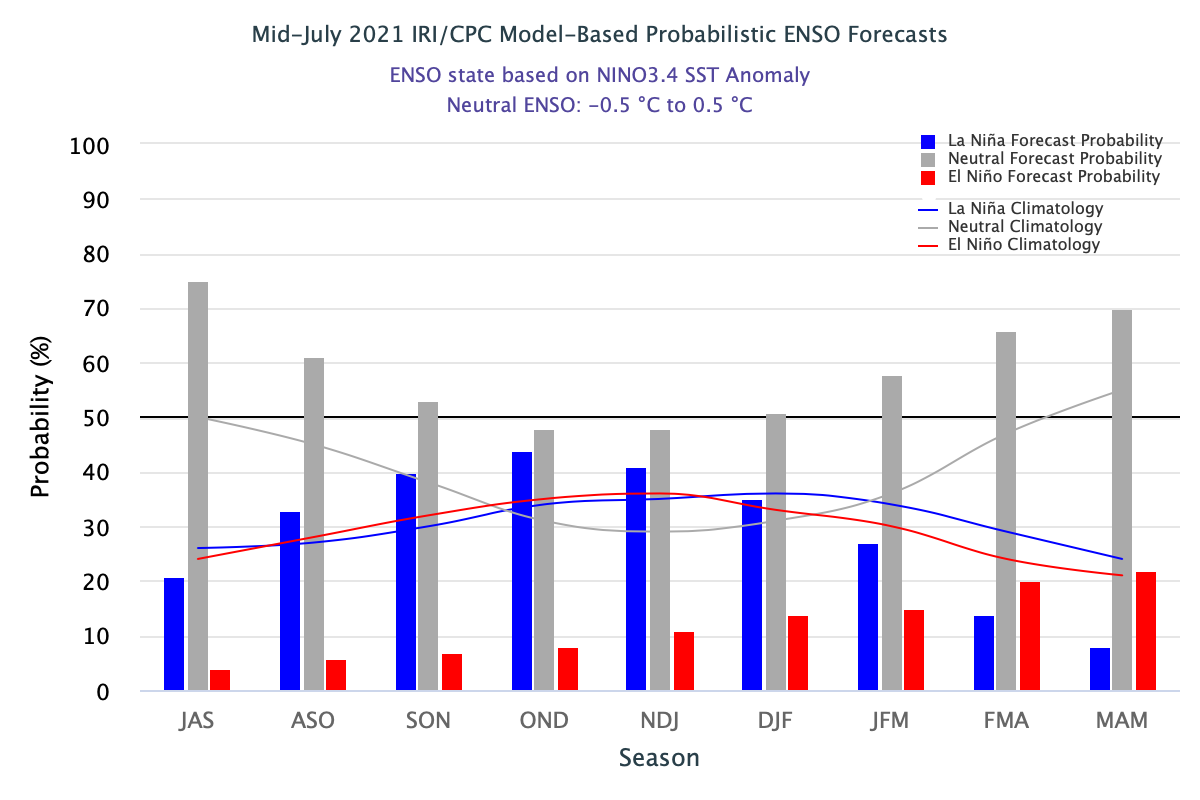
The latest set of model ENSO predictions from mid-July is now available in the IRI/CPC ENSO prediction plume. These are used to assess the probabilities of the three possible ENSO conditions by using the average value of the NINO3.4 SST anomaly predictions from all models on the plume, equally weighted. This month, however, the NASA-GEOS model was not factored into the probabilistic update, even though it appears on the plume-of-models graphic. A standard Gaussian error is imposed over that average forecast, and its width is determined by an estimate of overall expected model skill for the season of the year and the lead time. Higher skill results in a relatively narrower error distribution, while low skill results in an error distribution with width approaching that of the historical observed distribution. Using this method, chances for maintaining ENSO-neutral conditions is 75% for the Jul-Sep season. while chances for La Niña are 21%. ENSO-neutral remains the category with the highest probabilities throughout the forecast period. However, uncertainty increases later in the year. In the later seasons of 2021, about half of the dynamical models suggest a re-emergence of La Niña conditions; nearly all of the statistical models favor ENSO-neutral conditions throughout the forecast. In early 2022, ENSO-neutral again becomes the most likely outcome, with probabilities exceeding 50%.  El Niño probabilities start at 4% in Jul-Sep and slowly rise to around 10% by the end of the year, and then to near 20% in spring of 2022. A plot of the probabilities generated from this most recent IRI/CPC ENSO prediction plume using the multi-model mean and the Gaussian standard error method summarizes the model consensus out to about 10 months into the future.

Caution is advised in interpreting the forecast distribution from the Gaussian standard error as the actual probabilities, due to differing biases and performance of the different models. In particular, this approach considers only the mean of the predictions, and not the total range across the models, nor the ensemble range within individual models. At longer leads, the skill of the models degrades, and uncertainty in skill must be convolved with the uncertainties from initial conditions and differing model physics, which leads to more climatological probabilities in the long-lead ENSO Outlook than might be suggested by the suite of models. Furthermore, the expected skill of one model versus another has not been established using uniform validation procedures, which may cause a difference in the true probability distribution.

In summary, the probabilities derived from the models on the IRI/CPC plume indicate that ENSO-neutral is the most likely outcome through boreal summer, and still remain more likely than El Niño or a re-emergence of La Niña through the entire forecast period.

A caution regarding the model-based ENSO plume predictions released mid-month, is that factors such as known specific model biases and recent changes in the tropical Pacific that the models may have missed, are not considered. This approach is purely objective. Those issues are taken into account in the official outlooks, which are generated and issued early in the month by CPC and IRI, and which will include some human judgment in combination with the model guidance.


IRI ENSO Forecast Histogram Image
Season La Niña Neutral El Niño
JAS 21 75 4
ASO 33 61 6
SON 40 53 7
OND 44 48 8
NDJ 41 48 11
DJF 35 51 14
JFM 27 58 15
FMA 14 66 20
MAM 8 70 22

ENSO Forecast

IRI Model-Based Probabilistic ENSO Forecast

Published: July 19, 2021

A purely objective ENSO probability forecast, based on regression, using as input the model predictions from the plume of dynamical and statistical forecasts shown in the ENSO Predictions Plume. Each of the forecasts is weighted equally. It is updated near or just after the middle of the month, using forecasts from the plume models that are run in the first half of the month. It does not use any human interpretation or judgment. This is updated on the third Thursday of the month.


IRI ENSO Forecast Histogram Image


Season La Niña Neutral El Niño
JAS 21 75 4
ASO 33 61 6
SON 40 53 7
OND 44 48 8
NDJ 41 48 11
DJF 35 51 14
JFM 27 58 15
FMA 14 66 20
MAM 8 70 22

ENSO Forecast

CPC Official Probabilistic ENSO Forecast

Published: July 8, 2021

The official CPC ENSO probability forecast, based on a consensus of CPC and IRI forecasters. It is updated during the first half of the month, in association with the official CPC ENSO Diagnostic Discussion. It is based on observational and predictive information from early in the month and from the previous month. It uses human judgment in addition to model output, while the forecast shown in the Model-Based Probabilistic ENSO Forecast relies solely on model output. This is updated on the second Thursday of every month.


NOAA?CPC ENSO Forecast Image
NOAA/CPC ENSO Forecast Graphic, courtesy of NOAA/CPC

CPC/IRI Official Probabilistic ENSO Forecasts

Season La Niña Neutral El Niño
JJA 17 82 1
JAS 32 64 4
ASO 45 51 4
SON 55 42 3
OND 62 35 3
NDJ 66 31 3
DJF 60 36 4
JFM 54 42 4
FMA 47 49 4

ENSO Forecast

IRI ENSO Predictions Plume

Published: July 19, 2021

Note on interpreting model forecasts

The following graph and table show forecasts made by dynamical and statistical models for SST in the Nino 3.4 region for nine overlapping 3-month periods. Note that the expected skills of the models, based on historical performance, are not equal to one another. The skills also generally decrease as the lead time increases. Thirdly, forecasts made at some times of the year generally have higher skill than forecasts made at other times of the year--namely, they are better when made between June and December than when they are made between February and May. Differences among the forecasts of the models reflect both differences in model design, and actual uncertainty in the forecast of the possible future SST scenario.

Interactive Chart

You can highlight a specific model by hovering over it either on the chart or the legend. Selecting An item on the legend will toggle the visibility of the model on the page. You can also select DYN MODELS or STAT MODELS to toggle them all at once. Clicking on the "burger" menu above the legend will give you options to download the image or expand to full screen. If you have any feedback on this new feature, please let us know at webmaster@iri.columbia.edu.


List of Models Used


Forecast SST Anomalies (deg C) in the Nino 3.4 Region

Seasons (2021 – 2022)
Model JAS ASO SON OND NDJ DJF JFM FMA MAM
Dynamical Models
NASA GMAO -1.35 -1.88 -2.01 -1.97 -1.92 -1.78 -1.51
NCEP CFSv2 -0.26 -0.60 -1.01 -1.28 -1.38 -1.33 -1.20
JMA -0.16 -0.17 -0.19 -0.23 -0.21
BCC_CSM11m -0.11 -0.03 0.07 0.25 0.51 0.75 0.94 1.06 1.13
SAUDI-KAU 0.08 0.10 0.09 0.11 0.18 0.29 0.37 0.44 0.46
LDEO 0.22 0.26 0.24 0.21 0.10 0.02 0.02 0.05 0.05
AUS-ACCESS -0.47 -0.90 -1.13 -1.23
ECMWF -0.11 -0.23 -0.29 -0.38 -0.47
UKMO -0.61 -0.80 -0.92 -0.96
KMA -0.55 -0.92 -1.11 -1.20 -1.24
IOCAS ICM 0.23 0.20 0.17 0.13 0.10 0.07 0.03 -0.04 -0.10
COLA CCSM4 -0.23 -0.60 -0.88 -1.00 -1.02 -0.96 -0.71 -0.38 -0.10
MetFRANCE -0.04 -0.16 -0.28 -0.40 -0.40
SINTEX-F -0.32 -0.35 -0.37 -0.32 -0.22 -0.10 0.03 0.13 0.21
CS-IRI-MM -0.25 -0.39 -0.57 -0.73 -0.80 -0.71
GFDL SPEAR -0.31 -0.52 -0.77 -0.98 -1.04 -0.91 -0.61 -0.28 -0.03
CMC CANSIP -0.07 -0.25 -0.44 -0.63 -0.71 -0.69 -0.59 -0.47 -0.33
Average, Dynamical models -0.25 -0.43 -0.55 -0.62 -0.57 -0.49 -0.32 0.06 0.16
Statistical Models
NTU CODA -0.10 -0.04 0.03 0.04 0.02 -0.04 0.08 0.21 0.21
BCC_RZDM -0.15 -0.20 -0.23 -0.25 -0.31 -0.35 -0.33 -0.21 -0.10
CPC MRKOV -0.40 -0.34 -0.28 -0.20 -0.06 0.08 0.16 0.18 0.21
CPC CA 0.03 0.01 0.01 0.05 0.01 0.01 0.02 0.17 0.21
CSU CLIPR -0.21 -0.11 -0.00 0.10 0.03 -0.03 -0.10 -0.05 -0.01
IAP-NN -0.07 -0.01 0.09 0.20 0.28 0.36 0.44 0.55 0.64
FSU REGR -0.08 -0.05 -0.04 -0.02 -0.01 0.05 0.07 0.09 0.11
UCLA-TCD -0.33 -0.48 -0.65 -0.77 -0.81 -0.76 -0.62 -0.44 -0.27
Average, Statistical models -0.16 -0.15 -0.13 -0.11 -0.11 -0.09 -0.03 0.06 0.13
Average, All models -0.22 -0.34 -0.42 -0.46 -0.41 -0.32 -0.19 0.06 0.14

Discussion of Current Forecasts

Most of the models in the set of dynamical and statistical model predictions issued during mid-July 2021 show ENSO-neutral SST conditions likely to persist at least through the Sep-Nov season, and ENSO-neutral retains the highest probability of the three categories for all forecast periods shown.  In the most recent week, the SST anomaly in the NINO3.4 region was -0.1 C, indicative of ENSO-neutral, and -0.22 C for the month of June. As of mid-July, the subsurface water temperatures in the eastern equatorial Pacific are now just slightly above-average, though below-average temperatures exist just below.

A majority of the dynamical and statistical models predict ENSO-neutral conditions with 75% likelihood for the Jul-Sep season, decreasing to near 50% through the boreal winter, and then increasing again in early 2022. Based on the multi-model mean prediction, and the expected skill of the models by start time and lead time, the probabilities (X100) for La Niña, neutral and El Niño conditions (using -0.5C and 0.5C thresholds) over the coming 9 seasons are:

Season La Niña Neutral El Niño
JAS 21 75 4
ASO 33 61 6
SON 40 53 7
OND 44 48 8
NDJ 41 48 11
DJF 35 51 14
JFM 27 58 15
FMA 14 66 20
MAM 8 70 22

Summary of forecasts issued over last 22 months

The following interactive plot shows the model forecasts issued not only from the current month (as in the plot above), but also from the 21 months previous to this month. The observations are shown up to the most recently completed 3-month period. The plots allow comparison of plumes from the previous start times, or examination of the forecast behavior of a given model over time.
Hovering over any single model will highlight that particular model in the chart.
Clicking a particular model will hide/show that model in the chart.
At the bottom of the plot, you can select which models to show in the chart: all the models, the dynamical models only, or the statistical models only.


Notes on the data 

Only models producing forecasts on a monthly basis are included. This means that some models whose forecasts appear in the Experimental Long-Lead Forecast Bulletin (produced by COLA) do not appear in the table.

Once an IRI ENSO probability forecast has been published, the results stand even if a model reports an error and changes their data. When this happens we will update the plume with the model's correct values even though our forecast hasn't changed. What this means is that our forecast is always the same, but the underlying data may be different from what we based our forecast on.

The SST anomaly forecasts are for the 3-month periods shown, and are for the Nino 3.4 region (120-170W, 5N-5S). Often, the anomalies are provided directly in a graph or a table by the respective forecasting centers for the Nino 3.4 region. In some cases, however, they are given for 1-month periods, for 3-month periods that skip some of the periods in the above table, and/or only for a region (or regions) other than Nino 3.4. In these cases, the following means are used to obtain the needed anomalies for the table:

  • Temporal averaging
  • Linear temporal interpolation
  • Visual averaging of values on a contoured map

The anomalies shown are those with respect to the base period used to define the normals, which vary among the groups producing model forecasts. They have not been adjusted to anomalies with respect to a common base period. Discrepancies among the climatological SST resulting from differing base periods may be as high as a quarter of a degree C in the worst cases. Forecasters are encouraged to use the standard 1991-2020 period as the base period, or a period not very different from it.

Historical SST Anomalies Image

ENSO Forecast

Forecast Probability Distribution Based on the IRI ENSO Prediction Plume

Published: July 19, 2021


The plots on this page show predictions of seasonal (3-month average) sea surface temperature (SST) anomaly in the Niño3.4 region in the east-central tropical Pacific (5°N-5°S, 120°-170°W), covering the nine overlapping seasons beginning with the current month. The predictions are based on the large (20+) set of dynamical and statistical models in the plume of model ENSO predictions.


  • Model Based Prediction Percentiles Image

    Figure 5

    Predictions of ENSO are probabilistic. The ensemble mean prediction is only a best single guess. On either side of that prediction, there is a substantial uncertainty distribution, or error tolerance. The second plot (Figure 2) shows the estimated probability distribution of the predictions, showing a set of percentiles within that distribution for each lead time. The distribution is modeled as a normal (Gaussian) distribution, so that the overall mean forecast represents the center, or 50 percentile, in the distribution. The overall mean is formed using equal weighting among all models. On either side, other percentile values are shown symmetrically, ranging from 1 to 99 and including some intermediate percentiles (5 and 95, 15 and 85, and 25 and 75). The plot enables a user to estimate the probability of the Niño3.4 SST anomaly to be greater or less than some critical value, or within some interval. If, for example, the 85 percentile falls at 1.8° C above average, the probability of the SST exceeding 1.8° C can be estimated at 15%. Probabilities for exceeding or not exceeding values not exactly on percentile line can be roughly interpolated by eye. The overall width of the probability distribution is derived from the historical skill of the hindcasts of the models, from 1982 to present, for the specific forecast start time and lead time. This method of defining the probability distribution represents one of two general approaches, the other approach being a direct counting of ensemble members within each of the percentile bands. This second approach assumes that the ensemble spreads of the models are true representations of the uncertainty. Individual model spreads have often been found to be somwehate narrower than they should be, although in multi-model ensembles this tendency has been shown to be milder or even eliminated.

  • Model Based Prediction Distribution Image

    Figure 6

    Figure 6, sometimes called a spaghetti diagram, shows synthetically generated prediction scenarios that are equally likely. Here, 100 scenarios are shown; any number can be generated for such a diagram. Each scenario is produced using a random number generator, combined with knowledge of the mean forecast and its uncertainty, as well as the amount of persistence of anomalies. The degree of persistence of anomalies is based on the correlation of prediction errors from one lead time to another. In other words, the individual lines are designed to show the correct amount of persistence as expected in nature, rather than jumping around more randomly from one lead time to the next. The uncertainty and persistence statistics are based on the set of 7 NMME (North American Multimodel Ensemble) models, as it is assumed that these statistics are approximately applicable to all of the models. Sometimes the “spaghetti density” may appear asymmetric about the mean of all the forecasts or outside of the 85 and 15 percentile lines. This is purely sampling variability, and would not occur if many thousands of such lines were plotted. But with that many lines, most of the plot would be too crowded to get a sense of the behavior of the lines near the center of the distribution. The main purpose of the diagram is to serve users who want to assess realistic individual scenarios of ENSO behavior rather than statistical summaries of the forecast like the percentiles shown in the second plot.

The CPC ENSO forecast is released at 9am (Eastern Time) on the second Thursday of each month.

The IRI ENSO forecast is released on the 19th of each month. If the 19th falls on a weekend or holiday, it is released on the closest business day.

All data from this website is covered under the Creative Commons Attribution 4.0 License. When citing IRI ENSO images or data, please use "Images [or Data] provided by The International Research Institute for Climate and Society, Columbia University Climate School", with a link to https://iri.columbia.edu/ENSO.