ENSO Forecast Navigation

ENSO Forecasts

ENSO Forecast

2017 April Quick Look

Published: April 20, 2017

A monthly summary of the status of El Niño, La Niña, and the Southern Oscillation, or ENSO, based on the NINO3.4 index (120-170W, 5S-5N)

By mid-April 2017, the tropical Pacific remained in an ENSO-neutral state, with above-average SSTs present in the eastern Pacific Ocean, and near-average SSTs across the central and east-central part of the basin. Across the western and central Pacific, the pattern of cloudiness, rainfall, and winds remains suggestive of La Nina conditions. The collection of ENSO prediction models indicates increasing chances of El Nino into the summer and fall of 2017.

Figures 1 and 3 (the official CPC ENSO probability forecast and the objective model-based IRI ENSO probability forecast, respectively) are often quite similar. However, occasionally they may differ noticeably. There can be several reasons for differences. One possible reason is that the human forecasters, using their experience and judgment, may disagree to some degree with the models, which may have known biases. Another reason is related to the fact that the models are not run at the same time that the forecasters make their assessment, so that the starting ENSO conditions may be slightly different between the two times. The charts on this Quick Look page are updated at two different times of the month, so that between the second and the third Thursday of the month, the official forecast (Fig. 1) has just been updated, while the model-based forecasts (Figs. 3 and 4) are still from the third Thursday of the previous month. On the other hand, from the third Thursday of the month until the second Thursday of the next month, the model-based forecasts are more recently updated, while the official forecasts remain from the second Thursday of the current month.
Click on the for more information on each figure.

Historically Speaking

    El Niño and La Niña events tend to develop during the period Apr-Jun and they
  • Tend to reach their maximum strength during October - February
  • Typically persist for 9-12 months, though occasionally persisting for up to 2 years
  • Typically recur every 2 to 7 years

ENSO Forecast

CPC ENSO Update

Published: April 13, 2017

El Niño/Southern Oscillation (ENSO) Diagnostic Discussion issued by the Climate Prediction Center/NCEP/NWS

ENSO Alert System Status: Not Active

Synopsis: ENSO-neutral conditions are favored to continue through at least the Northern Hemisphere spring 2017, with increasing chances for El Niño development by late summer and fall.

ENSO-neutral conditions continued during March, with near-average sea surface temperatures (SSTs) across the central equatorial Pacific and above-average SSTs in the eastern Pacific (Fig. 1). The latest weekly Niño index values were near zero in the Niño-4 and Niño-3.4 regions, and +0.8 and +0.9°C farther east in the Niño-3 and Niño-1+2 regions, respectively (Fig. 2). The upper-ocean heat content anomaly, averaged across the central and eastern Pacific (Fig. 3), a reflection of generally above-average temperatures at depth (Fig. 4). Atmospheric convection remained suppressed over the central tropical Pacific and enhanced over the Maritime Continent (Fig. 5). The low-level easterly winds were enhanced over the central and western tropical Pacific, and weaker than average over the eastern Pacific. Also, upper-level westerly winds were anomalously easterly over the western and far eastern Pacific, while the Southern Oscillation Index was near average. Overall, the ocean and atmosphere system is consistent with ENSO-neutral conditions

Most models predict the continuation of ENSO-neutral (3-month average Niño-3.4 index between -0.5°C and 0.5°C) through the late Northern Hemisphere spring (Aril-June; Fig. 6). However, at least one-half of the dynamical model forecasts, including the NCEP CFSv2, anticipate an onset of El Niño as soon as the April-June season. Because of typically lower skill in forecasts made at this time of the year, and the lingering La Niña-like tropical convection and wind patterns over the western half of the Pacific basin, the forecaster consensus favors ENSO-neutral during April-June with a 60-65% chance. Thereafter, there are increasing odds for El Niño toward the second half of 2017 (~50% chance from approximately August-December). In summary, ENSO-neutral conditions are favored to continue through at least the late Northern Hemisphere spring 2017, with increasing chances for El Niño development by late summer and fall (click CPC/IRI consensus forecast for the chance of each outcome for each 3-month period).

This discussion is a consolidated effort of the National Oceanic and Atmospheric Administration (NOAA), NOAA’s National Weather Service, and their funded institutions. Oceanic and atmospheric conditions are updated weekly on the Climate Prediction Center web site (El Niño/La Niña Current Conditions and Expert Discussions). Forecasts are also updated monthly in the Forecast Forum section of CPC’s Climate Diagnostics Bulletin. Additional perspectives and analysis are also available in an ENSO blog.

The next ENSO Diagnostics Discussion is scheduled for 11 May 2017. To receive an e-mail notification when the monthly ENSO Diagnostic Discussions are released, please send an e-mail message to: ncep.list.enso-update@noaa.gov.

Climate Prediction Center
National Centers for Environmental Prediction
NOAA/National Weather Service
College Park, MD 20740


CPC/IRI Early-Month Official ENSO Forecast Probabilities

Season La Niña Neutral El Niño
MAM 2017 3% 76% 21%
AMJ 2017 5% 62% 33%
MJJ 2017 5% 53% 42%
JJA 2017 6% 49% 45%
JAS 2017 7% 45% 48%
ASO 2017 8% 42% 50%
SON 2017 9% 40% 51%
OND 2017 11% 38% 51%
NDJ 2017 12% 38% 50%

IRI ENSO Forecast

IRI Technical ENSO Update

Published: April 20, 2017

Note: The SST anomalies cited below refer to the OISSTv2 SST data set, and not ERSSTv4. OISSTv2 is often used for real-time analysis and model initialization, while ERSSTv4 is used for retrospective official ENSO diagnosis because it is more homogeneous over time, allowing for more accurate comparisons among ENSO events that are years apart. During ENSO events, OISSTv2 often shows stronger anomalies than ERSSTv4, and during very strong events the two datasets may differ by as much as 0.5 C. Additionally, the ERSSTv4 may tend to be cooler than OISSTv2, because ERSSTv4 is expressed relative to a base period that is updated every 5 years, while the base period of OISSTv2 is based on a slightly older period and does not account as much for the slow warming trend in the tropical Pacific SST.

Recent and Current Conditions

In mid-April 2017, the NINO3.4 SST anomaly remained in the neutral range, where it has been since late January with the ending of the borderline or weak La Niña during late 2016.  For March the SST anomaly was 0.10 C, and for Jan-Mar it was -0.03 C. The IRI’s definition of El Niño, like NOAA/Climate Prediction Center’s, requires that the SST anomaly in the Nino3.4 region (5S-5N; 170W-120W) exceed 0.5 C. Similarly, for La Niña, the anomaly must be -0.5 C or less. The climatological probabilities for La Niña, neutral, and El Niño conditions vary seasonally, and are shown in a table at the bottom of this page for each 3-month season. The most recent weekly anomaly in the Nino3.4 region was 0.2, at an ENSO-neutral level. The SST farther east has been at above-average levels for several months, and far above average during February and March making for a coastal El Niño during the rainy season in coastal southern Ecuador and northern Peru. Most of the pertinent atmospheric variables have also been assuming neutral patterns, except that the wind and convection anomalies in the central and western tropical Pacific continued to suggest borderline La Niña condtions. The lower-level trade winds and upper level westerly winds have been largely near-average, although there are still weakly enhanced trade winds in the west-central part of the basin, and enhanced westerlies aloft in the western portion of the basin — both remnants from the late 2016 weak La Niña. The Southern Oscillation Index (SOI) has been near-average during the last couple of months. Subsurface temperature anomalies across the eastern equatorial Pacific have been near to just slightly above average. Overall, given the SST and the atmospheric conditions, an ENSO-neutral diagnosis is in order.

Expected Conditions

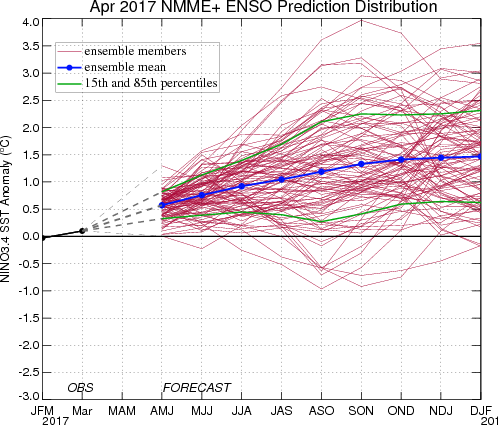
What is the outlook for the ENSO status going forward? The most recent official diagnosis and outlook was issued one week ago in the NOAA/Climate Prediction Center ENSO Diagnostic Discussion, produced jointly by CPC and IRI; it stated that ENSO-neutral is the most likely condition through northern spring 2017, with increasing chances (to ~50%) for El Niño development during the late summer or fall time frame. The latest set of model ENSO predictions, from mid-April, now available in the IRI/CPC ENSO prediction plume, is discussed below. Those predictions suggest that the SST is most likely to be in the ENSO-neutral range for Apr-Jun but with an increased likelihood for El Niño development from summer onward.

As of mid-April, 54% of the dynamical or statistical models predicts neutral ENSO conditions for the initial Apr-Jun 2017 season, while 46% predicts El Niño conditions and 0% predicts La Niña conditions. At lead times of 3 or more months into the future, statistical and dynamical models that incorporate information about the ocean’s observed subsurface thermal structure generally exhibit higher predictive skill than those that do not. For the Jul-Sep 2017 season, among models that do use subsurface temperature information, no model predicts La Niña conditions, 80% predicts El Niño conditions, while 20% predicts neutral ENSO. For all model types, the probabilities for La Niña are near zero for for all predicted seasons from Apr-Jun 2017 through Dec-Feb 2017-18. The probability for El Niño conditions exceeds 50% beginning with May-Jul and lasting throughout the rest of 2017. The chances for El Niño rise to about 55% for May-Jul, about 70% for Jun-Aug, between 75% and 85% for from Jul-Sep through the final season of Dec-Feb 2017-18. Chances for neutral ENSO conditions drop from near 55% for Apr-Jun to 25% or below from Jun-Aug through Dec-Feb 2017-18.

Note  – Only models that produce a new ENSO prediction every month are included in the above statement.

Caution is advised in interpreting the distribution of model predictions as the actual probabilities. At longer leads, the skill of the models degrades, and skill uncertainty must be convolved with the uncertainties from initial conditions and differing model physics, leading to more climatological probabilities in the long-lead ENSO Outlook than might be suggested by the suite of models. Furthermore, the expected skill of one model versus another has not been established using uniform validation procedures, which may cause a difference in the true probability distribution from that taken verbatim from the raw model predictions.

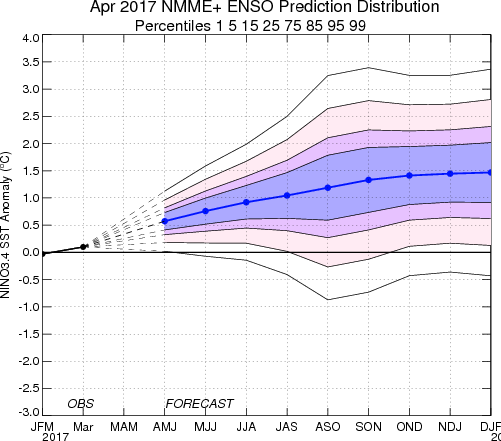
An alternative way to assess the probabilities of the three possible ENSO conditions is more quantitatively precise and less vulnerable to sampling errors than the categorical tallying method used above. This alternative method uses the mean of the predictions of all models on the plume, equally weighted, and constructs a standard error function centered on that mean. The standard error is Gaussian in shape, and has its width determined by an estimate of overall expected model skill for the season of the year and the lead time. Higher skill results in a relatively narrower error distribution, while low skill results in an error distribution with width approaching that of the historical observed distribution. This method shows probabilities for La Niña at less than 10% from Apr-Jun 2017 through the final season of Dec-Feb 2017-18. Probabilities for ENSO-neutral are 62% for Apr-Jun, falling to 35% by Jun-Aug, and remaining at about 25-30% from Jul-Sep through Dec-Feb 2017-18. Probabilities for El Niño are 38% for Apr-Jun, rise to 56% for May-Jul and to approximately 63-69% from Jun-Aug through to the final season of Dec-Feb 2017-18. A plot of the probabilities generated from this most recent IRI/CPC ENSO prediction plume using the multi-model mean and the Gaussian standard error method summarizes the model consensus out to about 10 months into the future. The same cautions mentioned above for the distributional count of model predictions apply to this Gaussian standard error method of inferring probabilities, due to differing model biases and skills. In particular, this approach considers only the mean of the predictions, and not the total range across the models, nor the ensemble range within individual models.

In summary, the probabilities derived from the models on the IRI/CPC plume describe, on average, a likelihood for neutral ENSO conditions for Apr-Jun 2017. Beginning with May-Jul, El Niño becomes more likely than neutral through the final season of Dec-Feb 2017-18. Although most likely, the chances for El Niño are not overwhelming, reaching approximately two-thirds from Jul-Sep through Nov-Jan 2017-18. Chances for La Niña are very low throughout the forecast period.  A caution regarding this latest set of model-based ENSO plume predictions, is that factors such as known specific model biases and recent changes that the models may have missed will be taken into account in the next official outlook to be generated and issued in early April by CPC and IRI, which will include some human judgement in combination with the model guidance.

Climatological Probabilities

Season La Niña Neutral El Niño
DJF 36% 30% 34%
JFM 34% 38% 28%
FMA 28% 49% 23%
MAM 23% 56% 21%
AMJ 21% 58% 21%
MJJ 21% 56% 23%
JJA 23% 54% 23%
JAS 25% 51% 24%
ASO 26% 47% 27%
SON 29% 39% 32%
OND 32% 33% 35%
NDJ 35% 29% 36%


IRI ENSO Forecast Histogram Image

IRI/CPC Mid-Month Model-Based ENSO Forecast Probabilities

Season La Niña Neutral El Niño
AMJ 2017 0% 62% 38%
MJJ 2017 0% 44% 56%
JJA 2017 1% 35% 64%
JAS 2017 2% 31% 67%
ASO 2017 3% 28% 69%
SON 2017 5% 28% 67%
OND 2017 7% 26% 67%
NDJ 2017 7% 28% 65%
DJF 2018 7% 30% 63%

ENSO Forecast

IRI Model-Based Probabilistic ENSO Forecast

Published: April 20, 2017

A purely objective ENSO probability forecast, based on regression, using as input the model predictions from the plume of dynamical and statistical forecasts shown in the ENSO Predictions Plume. Each of the forecasts is weighted equally. It is updated near or just after the middle of the month, using forecasts from the plume models that are run in the first half of the month. It does not use any human interpretation or judgment. This is updated on the third Thursday of the month.


IRI ENSO Forecast Histogram Image


IRI/CPC Mid-Month Model-Based ENSO Forecast Probabilities

Season La Niña Neutral El Niño
AMJ 2017 0% 62% 38%
MJJ 2017 0% 44% 56%
JJA 2017 1% 35% 64%
JAS 2017 2% 31% 67%
ASO 2017 3% 28% 69%
SON 2017 5% 28% 67%
OND 2017 7% 26% 67%
NDJ 2017 7% 28% 65%
DJF 2018 7% 30% 63%

ENSO Forecast

CPC Official Probabilistic ENSO Forecast

Published: April 13, 2017

The official CPC ENSO probability forecast, based on a consensus of CPC and IRI forecasters. It is updated during the first half of the month, in association with the official CPC ENSO Diagnostic Discussion. It is based on observational and predictive information from early in the month and from the previous month. It uses human judgment in addition to model output, while the forecast shown in the Model-Based Probabilistic ENSO Forecast relies solely on model output. This is updated on the second Thursday of every month.


NOAA?CPC ENSO Forecast Image
NOAA/CPC ENSO Forecast Graphic, courtesy of NOAA/CPC

CPC/IRI Early-Month Official ENSO Forecast Probabilities

Season La Niña Neutral El Niño
MAM 2017 3% 76% 21%
AMJ 2017 5% 62% 33%
MJJ 2017 5% 53% 42%
JJA 2017 6% 49% 45%
JAS 2017 7% 45% 48%
ASO 2017 8% 42% 50%
SON 2017 9% 40% 51%
OND 2017 11% 38% 51%
NDJ 2017 12% 38% 50%

ENSO Forecast

IRI ENSO Predictions Plume

Published: April 20, 2017

Note on interpreting model forecasts

The following graph and table show forecasts made by dynamical and statistical models for SST in the Nino 3.4 region for nine overlapping 3-month periods. Note that the expected skills of the models, based on historical performance, are not equal to one another. The skills also generally decrease as the lead time increases. Thirdly, forecasts made at some times of the year generally have higher skill than forecasts made at other times of the year--namely, they are better when made between June and December than when they are made between February and May. Differences among the forecasts of the models reflect both differences in model design, and actual uncertainty in the forecast of the possible future SST scenario.

Interactive Chart

You can highlight a specific model by hovering over it either on the chart or the legend. Selecting An item on the legend will toggle the visibility of the model on the page. You can also select DYN MODELS or STAT MODELS to toggle them all at once. Clicking on the "burger" menu above the legend will give you options to download the image or expand to full screen. If you have any feedback on this new feature, please let us know at webmaster@iri.columbia.edu.


Notice about the NASA-GMAO model ENSO forecasts

GMAO staff discovered a mistake in the calculation of ensemble mean fields that resulted in an under-representation of ensemble spread and an over-representation of error in the ensemble mean. The mistake impacts forecasts from Feb 2017 through July 2019, and has been corrected as of August 2019. All forecasts hence will have the correct fields. We have not corrected any previous forecast output sent to IRI. If you need the retroactive corrected fields, please contact GMAO at: anna.borovikov@nasa.gov, kazumi.nakada@nasa.gov


List of Models Used


Forecast SST Anomalies (deg C) in the Nino 3.4 Region

Seasons (2017-2018)
Model AMJ MJJ JJA JAS ASO SON OND NDJ DJF
Dynamical models
NASA GMAO model 0.2 0.5 0.7 0.9 1.1 1.3 1.3
NCEP CFS version 2 0.5 0.8 0.8 0.8 0.7 0.8 0.9 1
Japan Met. Agency model 0.7 0.8 0.8 0.8 0.9
Scripps Inst. HCM 0.5 0.4 0.4 0.3 0.2 0.1 -0.1 -0.2 -0.4
King Abdulaziz University (Saudi Arabia) 0.8 1 1.2 1.4 1.5 1.6 1.8 1.9 1.8
Lamont-Doherty model 0.3 0.2 0.1 0 -0.2 -0.2 -0.3 -0.3 -0.2
POAMA (Austr) model 0.4 0.4 0.6 0.8 0.9 1 1.2
ECMWF model 0.4 0.6 0.8 0.9 1.1
UKMO model 0.4 0.4 0.5 0.6
KMA (Korea) SNU model 0.1 0.2 0.4 0.6 0.7 0.8 0.8 0.7 0.6
IOCAS (China) Intermed. Coupled model 0.6 0.8 0.9 0.9 0.9 0.9 0.9 0.9 0.9
COLA CCSM4 model 0.6 0.7 0.7 0.7 0.7 0.7 0.7 0.7 0.8
MÉTÉO FRANCE model 0.4 0.6 0.8 0.9 1.1
Japan Frontier Coupled model 0.8 1 1.3 1.5 1.7 1.8 1.8 1.9 1.8
CSIR-IRI 3-model MME 0.1 0.3 0.6 0.9 1.1 1.2
GFDL CM2.1 Coupled Climate model 0.8 1.2 1.5 1.6 1.5 1.4 1.4 1.4 1.2
Canadian Coupled Fcst Sys 0.7 0.8 1 1.1 1.1 1.2 1.3 1.5 1.5
GFDL CM2.5 FLOR Coupled Climate model 0.7 1 1.3 1.6 1.8 2 2.1 2.1 2
Average, dynamical models 0.5 0.6 0.8 0.9 1 1 1.1 1.1 1
Statistical models
NCEP/CPC Markov model -0.1 -0.2 -0.2 -0.3 -0.3 -0.4 -0.4 -0.3 -0.2
NCEP/CPC Constructed Analog 0.3 0.4 0.4 0.6 0.7 0.8 0.8 0.7 0.6
Landsea/Knaff CLIPER 0.4 0.5 0.6 0.7 0.8 0.9 1 0.9 0.8
Univ. BC Neural Network 0.3 0.4 0.5 0.6 0.7 0.7 0.8 0.8 0.6
FSU Regression 0 0 0 0 -0.1 -0.1 -0.1 -0.1 -0.1
TCD – UCLA 0.6 0.8 1 1.1 1.2 1.2 1.2 1.1 1
Average, statistical models 0.3 0.3 0.4 0.4 0.5 0.5 0.5 0.5 0.5
Average, all models 0.4 0.6 0.7 0.8 0.9 0.9 0.9 0.9 0.8

Discussion of Current Forecasts

Most of the models in the set of dynamical and statistical model predictions issued during late March and early April 2017 predicts neutral ENSO conditions during the April-June period, but with increasing chances for El Niño development during summer and fall.  In the most recent week, the SST anomaly in the Nino3.4 region was 0.2 C, at a neutral level, and 0.10 C for the month of March, also ENSO-neutral.  The atmospheric variables continue to reflect mainly neutral patterns, except that the pattern of convection and low-level winds over the central and western tropical Pacific continue to suggest borderline La Niña conditions while the conditions much farther to the east have been more El Niño-like. For northern summer and fall of 2017, many of the dynamical models tend to favor El Niño development, while only about half of the statistical models do. Based on the multi-model mean predictions, and the expected skill of the models by start time and lead time, the probabilities (X100) for La Niña, neutral and El Niño conditions (using -0.5C and 0.5C thresholds) over the coming 9 seasons are:

IRI/CPC Mid-Month Model-Based ENSO Forecast Probabilities

Season La Niña Neutral El Niño
AMJ 2017 0% 62% 38%
MJJ 2017 0% 44% 56%
JJA 2017 1% 35% 64%
JAS 2017 2% 31% 67%
ASO 2017 3% 28% 69%
SON 2017 5% 28% 67%
OND 2017 7% 26% 67%
NDJ 2017 7% 28% 65%
DJF 2018 7% 30% 63%

Summary of forecasts issued over last 22 months

The following interactive plot shows the model forecasts issued not only from the current month (as in the plot above), but also from the 21 months previous to this month. The observations are shown up to the most recently completed 3-month period. The plots allow comparison of plumes from the previous start times, or examination of the forecast behavior of a given model over time.
Hovering over any single model will highlight that particular model in the chart.
Clicking a particular model will hide/show that model in the chart.
At the bottom of the plot, you can select which models to show in the chart: all the models, the dynamical models only, or the statistical models only.


Notes on the data 

Only models producing forecasts on a monthly basis are included. This means that some models whose forecasts appear in the Experimental Long-Lead Forecast Bulletin (produced by COLA) do not appear in the table.

Once an IRI ENSO probability forecast has been published, the results stand even if a model reports an error and changes their data. When this happens we will update the plume with the model's correct values even though our forecast hasn't changed. What this means is that our forecast is always the same, but the underlying data may be different from what we based our forecast on.

The SST anomaly forecasts are for the 3-month periods shown, and are for the Nino 3.4 region (120-170W, 5N-5S). Often, the anomalies are provided directly in a graph or a table by the respective forecasting centers for the Nino 3.4 region. In some cases, however, they are given for 1-month periods, for 3-month periods that skip some of the periods in the above table, and/or only for a region (or regions) other than Nino 3.4. In these cases, the following means are used to obtain the needed anomalies for the table:

  • Temporal averaging
  • Linear temporal interpolation
  • Visual averaging of values on a contoured map

The anomalies shown are those with respect to the base period used to define the normals, which vary among the groups producing model forecasts. They have not been adjusted to anomalies with respect to a common base period. Discrepancies among the climatological SST resulting from differing base periods may be as high as a quarter of a degree C in the worst cases. Forecasters are encouraged to use the standard 1991-2020 period as the base period, or a period not very different from it.

Historical SST Anomalies Image

ENSO Forecast

Forecast Probability Distribution Based on the IRI ENSO Prediction Plume

Published: April 20, 2017


The plots on this page show predictions of seasonal (3-month average) sea surface temperature (SST) anomaly in the Niño3.4 region in the east-central tropical Pacific (5°N-5°S, 120°-170°W), covering the nine overlapping seasons beginning with the current month. The predictions are based on the large (20+) set of dynamical and statistical models in the plume of model ENSO predictions.


  • Model Based Prediction Percentiles Image

    Figure 5

    Predictions of ENSO are probabilistic. The ensemble mean prediction is only a best single guess. On either side of that prediction, there is a substantial uncertainty distribution, or error tolerance. The second plot (Figure 2) shows the estimated probability distribution of the predictions, showing a set of percentiles within that distribution for each lead time. The distribution is modeled as a normal (Gaussian) distribution, so that the overall mean forecast represents the center, or 50 percentile, in the distribution. The overall mean is formed using equal weighting among all models. On either side, other percentile values are shown symmetrically, ranging from 1 to 99 and including some intermediate percentiles (5 and 95, 15 and 85, and 25 and 75). The plot enables a user to estimate the probability of the Niño3.4 SST anomaly to be greater or less than some critical value, or within some interval. If, for example, the 85 percentile falls at 1.8° C above average, the probability of the SST exceeding 1.8° C can be estimated at 15%. Probabilities for exceeding or not exceeding values not exactly on percentile line can be roughly interpolated by eye. The overall width of the probability distribution is derived from the historical skill of the hindcasts of the models, from 1982 to present, for the specific forecast start time and lead time. This method of defining the probability distribution represents one of two general approaches, the other approach being a direct counting of ensemble members within each of the percentile bands. This second approach assumes that the ensemble spreads of the models are true representations of the uncertainty. Individual model spreads have often been found to be somwehate narrower than they should be, although in multi-model ensembles this tendency has been shown to be milder or even eliminated.

  • Model Based Prediction Distribution Image

    Figure 6

    Figure 6, sometimes called a spaghetti diagram, shows synthetically generated prediction scenarios that are equally likely. Here, 100 scenarios are shown; any number can be generated for such a diagram. Each scenario is produced using a random number generator, combined with knowledge of the mean forecast and its uncertainty, as well as the amount of persistence of anomalies. The degree of persistence of anomalies is based on the correlation of prediction errors from one lead time to another. In other words, the individual lines are designed to show the correct amount of persistence as expected in nature, rather than jumping around more randomly from one lead time to the next. The uncertainty and persistence statistics are based on the set of 7 NMME (North American Multimodel Ensemble) models, as it is assumed that these statistics are approximately applicable to all of the models. Sometimes the “spaghetti density” may appear asymmetric about the mean of all the forecasts or outside of the 85 and 15 percentile lines. This is purely sampling variability, and would not occur if many thousands of such lines were plotted. But with that many lines, most of the plot would be too crowded to get a sense of the behavior of the lines near the center of the distribution. The main purpose of the diagram is to serve users who want to assess realistic individual scenarios of ENSO behavior rather than statistical summaries of the forecast like the percentiles shown in the second plot.

The CPC ENSO forecast is released at 9am (Eastern Time) on the second Thursday of each month.

The IRI ENSO forecast is released on the 19th of each month. If the 19th falls on a weekend or holiday, it is released on the closest business day.

All data from this website is covered under the Creative Commons Attribution 4.0 License. When citing IRI ENSO images or data, please use "Images [or Data] provided by The International Research Institute for Climate and Society, Columbia University Climate School", with a link to https://iri.columbia.edu/ENSO.