October Climate Briefing: El Niño Odds Greater than 85%
Read our ENSO Essentials & Impacts pages for more about El Niño and La Niña.
Tony Barnston provides an overview of the briefing:
What’s New
Sea-surface temperatures are warming up in the equatorial region of the Pacific Ocean that defines El Niño events (called Niño3.4 – see map below). Whether they stay that way will determine if an El Niño event is officially declared in the coming months. For months computer models have been predicting a looming El Niño, but oceanic and atmospheric conditions had remained, for the most part, stubbornly in the neutral range. Over the last four weeks, sea-surface temperature (SST) anomalies in the Niño3.4 region averaged +0.55ºC — just over the +0.50ºC threshold that helps define El Niño. The Niño3.4 region averaged +0.28ºC the previous four weeks.
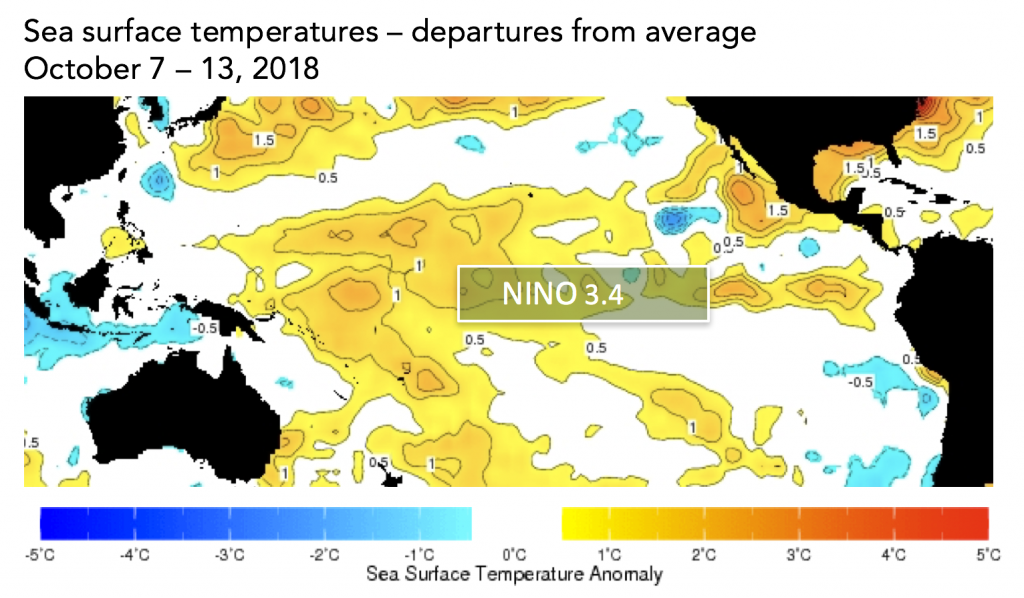
The sea-surface temperatures in the Nino3.4 region (approximated here) serve as a primary metric of El Niño and La Niña conditions. Data from the IRI Data Library. Image: IRI/Elisabeth Gawthrop
Models likely continued to predict El Niño over the last few months because of the presence of warm temperatures below the surface of the ocean. Those temperatures have also increased in the last few weeks.
Certain atmospheric conditions must also be present for an El Niño to be sustained. So far the atmospheric indicators, including wind patterns, convection patterns and the Southern Oscillation Index, are not yet showing strong signs of El Niño development. But if the warm SSTs persist, the atmospheric components of an El Niño event will be likely to kick in. More on how El Niño forms on our ENSO resource page.
The data in this figure shows one of the biggest reasons we keep forecasting #ElNino, says Barnston. These warm ocean temperatures below the surface have been expected to come to the surface. And now they’re getting even warmer. #IRIForecast pic.twitter.com/RYjEIIzOyB
— IRI (@climatesociety) October 18, 2018
In the last couple of weeks, the warm sea temperatures appear to finally be breaking through the surface. They show up in this image in the center figure at the very bottom. #ElNino #IRIforecast pic.twitter.com/GkJQs5ORh2
— IRI (@climatesociety) October 18, 2018
For an El Niño to be made official in the historical record, the Niño3.4 SST anomaly would have to stay above the +0.5ºC threshold for five consecutive, overlapping three-month averages. With the warmer SSTs, and the continued warming of the subsurface sea temperatures, the odds for an El Niño in the coming months have increased since last month’s forecast. There is now an 86% chance, based on the models, that an El NIño will begin in this current October – December season, and an 88% chance that an El Niño event will sustain several months into 2019. If scientists from IRI and the National Oceanic and Atmospheric Administration’s Climate Prediction Center (CPC) believe next month that the elevated SSTs will persist, they could declare an El Niño advisory, meaning that El Niño conditions are observed and expected to continue. In June, CPC/IRI issued an El Niño Watch, which remains in effect.
Seasonal temperature and precipitation forecasts based on the latest data show some influence from the predicted El Niño. The strongest effects on precipitation patterns are in Indonesia, the Philippines and Australia, with moderate-to-high odds for drier-than-average conditions. The El Niño signal for United States precipitation patterns is not as strong as some years, with only slightly raised odds for a wetter-than-average winter across the southern part of the country. See more on the seasonal forecasts further down in this post.
ENSO Forecasts
To predict ENSO conditions, computers model the SSTs in the Nino3.4 region over the next several months. The plume graph below shows the outputs of these models, some of which use equations based on our physical understanding of the system (called dynamical models), and some of which use statistics, based on the long record of historical observations.
As in the last few months, models’ predictions of the SST anomalies in Nino3.4 show the development of an El Niño. The averages of both the dynamical and statistical models predict an El Niño event right on the weak/moderate borderline of +1.0ºC. The dynamical models predict the strongest season to be December – February, topping out with a mean of +1.05ºC. The statistical models also predict December – February to be the strongest, with a slightly lower prediction of +0.99ºC.
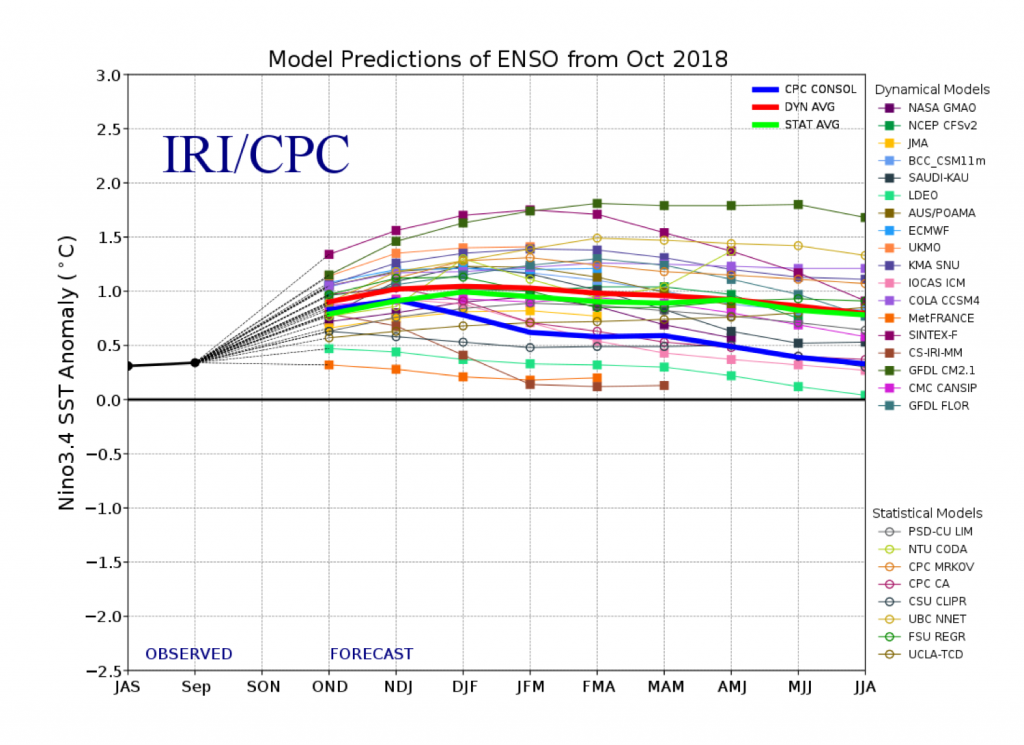
This graph shows forecasts made by dynamical and statistical models for SST in the Nino 3.4 region for nine overlapping 3-month periods. Note that the expected skills of the models, based on historical performance, are not equal to one another.

The IRI/CPC probabilistic ENSO forecast issued mid-October 2018. Note that bars indicate likelihood of El Niño occurring, not its potential strength. Unlike the official ENSO forecast issued at the beginning of each month, IRI and CPC issue this updated forecast based solely on model outputs. The official forecast, available at http://1.usa.gov/1j9gA8b, also incorporates human judgement.
Based on the model outputs, odds for El Niño conditions are above 85% through the March – April season. The chances for El Niño conditions are lower in the official probabilistic forecast issued by CPC and IRI in early October than in this mid-month CPC/IRI forecast. This early-October forecast uses human judgement in addition to model output, while the mid-month forecast relies solely on model output. More on the difference between these forecasts in this IRI Medium post.
ENSO in context: Resource page on climate variability
Regarding the ending of the possible El Nino event, the official forecast calls for neutral conditions as the most likely ENSO state beginning in the May – July 2019 season, while odds remain high for El Niño during that season in the models. Barnston said this could point to either a late-to-end El Nino event, or it could be a sign that we’ll have a two-year El Niño event.
IRI’s Global Seasonal Forecasts
Each month, IRI issues seasonal climate forecasts for the entire globe. These forecasts take into account the latest model outputs and indicate which areas are more likely to see above- or below-normal temperatures and precipitation.
Our seasonal precip forecasts. Some very canonical expected dry effects in Indonesia, Australia, NE South America. Tendency toward wet in Southeast SA. Southern Africa, oddly, tending to wet until at least spring 2019. #IRIforecast pic.twitter.com/gDI7zYk35r
— IRI (@climatesociety) October 18, 2018
For the upcoming November – January season, odds are strongly tipped in favor of below-normal rainfall across the Philippines and parts of Indonesia. Australia, the Caribbean and parts of Central America have moderately increased odds for below-normal precipitation. Much of the Middle East is given moderately increased odds for above-average precipitation, and southeastern South America, southern Africa, eastern Africa and the southern and eastern United States have slightly increased odds for above-average precipitation.
All forecast maps, including temperature in addition to precipitation, and also including a description of the methodologies, are available on our seasonal forecast page. Additional forecast formats, such as our flexible forecast maproom, are available in the IRI Data Library.
Learn more about El Niño and La Niña on our ENSO resources page, and sign up here to get notified when the next forecast is issued. In the meantime, check out #IRIforecast.
You must be logged in to post a comment.