November Climate Briefing: La Niña Makes it Official
Read our ENSO Essentials & Impacts pages for more about El Niño and La Niña.
Tony Barnston provides an overview of the briefing
What’s New
Since last month’s briefing, sea-surface temperatures (SSTs) have cooled further in the area of the central equatorial Pacific Ocean that helps define El Niño and La Niña events, called the Nino3.4 region (see map below). The weekly SST anomalies in the last month have ranged from -1.1ºC to -0.4ºC; their average lies in the category of a weak La Niña state, although conditions will have to persist for several months for a La Niña to be officially documented in the historical record.
Because IRI and the National Oceanic and Atmospheric Administration’s Climate Prediction Center predict that these conditions will continue in the near-term, the ENSO alert level was upgraded from a La Niña Watch to a La Niña Advisory.
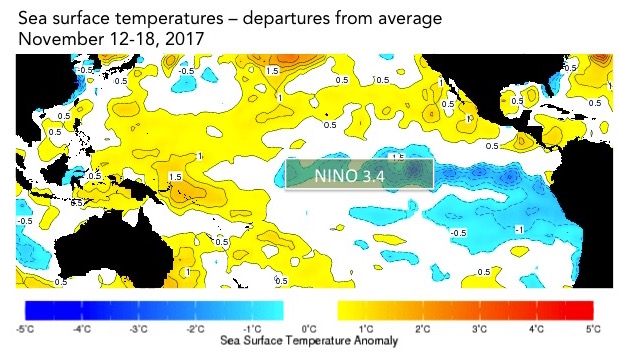
The sea-surface temperatures in the Nino3.4 region (approximated here) serve as a primary metric of El Niño and La Niña conditions. Data from the IRI Data Library. Image: IRI/Elisabeth Gawthrop
ENSO Forecasts
From the Earth Institute: How Will La Niña Affect Winter in the U.S.?
To predict ENSO conditions, computers model the SSTs in the Nino3.4 region over the next several months. The plume graph below shows the outputs of these models, some of which use equations based on our physical understanding of the system (called dynamical models), and some of which use statistics, based on the long record of historical observations.
The SST anomalies predicted by the models in this month’s forecast are similar to the predictions in last month’s forecast, but with slightly more agreement among all of the models. The average of the dynamical models has gotten somewhat cooler, reflecting almost a moderate La Niña state in their predictions through early 2018. The statistical model mean remains at a borderline La Niña state for the next few months.


Based on the model outputs, La Niña conditions are the most likely ENSO outcome through early 2018, with odds topping out at 75% for the November-January season. Neutral conditions take over as the most likely during the February-April 2018 season and continuing through the rest of the forecast period.
ENSO in context: Resource page on climate variability
The official probabilistic forecast issued by CPC and IRI in early November indicates a similar overall outlook. This early-November forecast uses human judgement in addition to model output, while the mid-month forecast relies solely on model output. More on the difference between these forecasts in this IRI Medium post.
IRI’s Global Seasonal Forecasts
Each month, IRI issues seasonal climate forecasts for the entire globe. These forecasts take into account the latest model outputs and indicate which areas are more likely to see above- or below-normal temperatures and rainfall.
Here’s the latest forecast for the upcoming season of December – February. Some signature #LaNiña impacts, such as high chance for dry weather in SE United States. #IRIforecast pic.twitter.com/YCXoROGWJX
— IRI (@climatesociety) November 16, 2017
For the upcoming December 2017 – February 2018 season, odds are tipped in favor of above-normal rainfall in the Philippines and parts of Indonesia, as well as northern Russia, northern South America and parts of eastern equatorial Africa. The southeastern United States shows the strongest, most widespread probabilities for drier-than-normal conditions. The southwestern United States and western Mexico, as well as smaller, scattered areas around the world, show some increased chance for drier-than-normal conditions.
The positive Indian Ocean Dipole also continues its influence on some areas, notably in eastern equatorial Africa, where the typical La Niña teleconnection might predict drier-than-normal conditions. Australia is also not expecting typical La Niña impacts, as outlined in this blog post from their Bureau of Meteorology.
All forecast maps, including temperature in addition to precipitation, are available on our seasonal forecast page.
As of April of this year, these seasonal forecasts use a new methodology. The IRI probabilistic seasonal climate forecast product is now based on a re-calibration of model output from the NOAA’s North American Multi-Model Ensemble Project (NMME). The output from each NMME model is re-calibrated prior to multi-model ensembling to form reliable probability forecasts. The forecasts are now presented on a 1-degree latitude-longitude grid. More on this change on the seasonal forecast page, as well as in this Q&A with three of our climate scientists.
Learn more about El Niño and La Niña on our ENSO resources page, and sign up here to get notified when the next forecast is issued. In the meantime, check out #IRIforecast.
You must be logged in to post a comment.