October Climate Briefing: Winter is Coming and so is (probably) La Niña
Read our ENSO Essentials & Impacts pages for more about El Niño and La Niña.
Tony Barnston provides an overview of the briefing
What’s New
As winter approaches in the northern hemisphere and summer in the southern, seasonal forecasts in both hemispheres are showing some typical La Niña climate impacts as well as some surprises. Since last month’s briefing, sea-surface temperatures (SSTs) have continued to be on the cool side of neutral in the central equatorial Pacific Ocean that define El Niño and La Niña events, called the Nino3.4 region (see map below). The weekly SST anomalies in the last month have ranged from -0.8ºC to 0ºC; their average is on the borderline of a La Niña state, although conditions would have to persist for several months for a La Niña to be officially recognized and documented.
Atmospheric variables, including tradewinds and convection patterns, as well as sub-surface ocean temperatures, indicate a La Niña event could be on the brink of development, but are not strong enough to guarantee a La Niña will fully form.
The National Oceanic and Atmospheric Administration’s Climate Prediction Center’s ENSO alert system maintained the status of La Niña Watch, which was first issued last month.
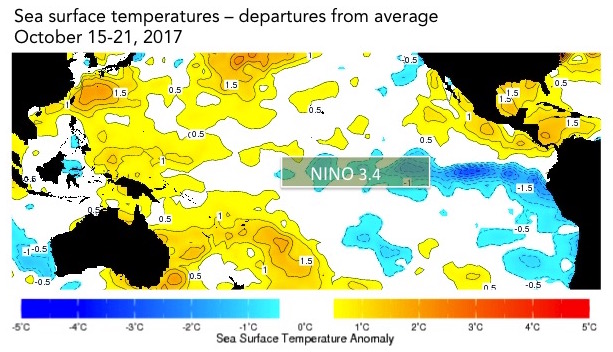
The sea-surface temperatures in the Nino3.4 region (approximated here) serve as a primary metric of El Niño and La Niña conditions. Data from the IRI Data Library. Image: IRI/Elisabeth Gawthrop
ENSO Forecasts
To predict ENSO conditions, computers model the SSTs in the Nino3.4 region over the next several months. The plume graph below shows the outputs of these models, some of which use equations based on our physical understanding of the system (called dynamical models), and some of which use statistics, based on the long record of historical observations.
The SST anomalies predicted by the models in last month’s forecast were mostly in the negative range, but many were in the neutral zone (above -0.5ºC). In this month’s forecast, most of the models are below the -0.5ºC La Niña threshold for the next few months.


Based on the model outputs, La Niña conditions are the most likely ENSO outcome through early 2018, with odds topping out at 70% for the November-January season. Neutral conditions become the most February-April 2018 season.
ENSO in context: Resource page on climate variability
The official probabilistic forecast issued by CPC and IRI in early October indicates a similar overall outlook. This early-October forecast uses human judgement in addition to model output, while the mid-month forecast relies solely on model output. More on the difference between these forecasts in this IRI Medium post.
IRI’s global seasonal forecasts
Each month, IRI issues seasonal climate forecasts for the entire globe. These forecasts take into account the latest model outputs and indicate which areas are more likely to see above- or below-normal temperatures and rainfall.
Here’s the seasonal precipitation #IRIforecast for upcoming months. Some are expected #LaNina impacts, others are not (e.g. Horn of Africa). pic.twitter.com/379yXTnqwZ
— IRI (@climatesociety) October 19, 2017
For the upcoming November 2017 – January 2018 season, odds are tipped in favor of above-normal rainfall in the Philippines, as well as northeastern Russia, Central America and northern South America. The south-central and southeastern United States and northern and central Mexico show the strongest, most widespread probabilities for drier-than-normal conditions. Parts of Asia and South America also show some increased chance for drier-than-normal conditions.
While some of the climate impacts are typical teleconnections associated with La Niña, others are less typical. For example, eastern equatorial Africa shows a slight favoring of above-average precipitation — likely due to the influence of the positive Indian Ocean Dipole — which is not the typical expected La Niña climate impact in that region.
All forecast maps, including temperature in addition to precipitation, are available on our seasonal forecast page.
As of April of this year, these seasonal forecasts use a new methodology. The IRI probabilistic seasonal climate forecast product is now based on a re-calibration of model output from the NOAA’s North American Multi-Model Ensemble Project (NMME). The output from each NMME model is re-calibrated prior to multi-model ensembling to form reliable probability forecasts. The forecasts are now presented on a 1-degree latitude-longitude grid. More on this change on the seasonal forecast page, as well as in this Q&A with three of our climate scientists.
Learn more about El Niño and La Niña on our ENSO resources page, and sign up here to get notified when the next forecast is issued. In the meantime, check out #IRIforecast.
You must be logged in to post a comment.