May Climate Briefing: ENSO Neutral, but Other Climate Impacts in Forecast
Read our ENSO Essentials & Impacts pages for more about El Niño and La Niña.
Tony Barnston provides an overview of the briefing:
What’s New
Sea-surface temperature (SST) anomalies in the equatorial Pacific Ocean have continued to warm since last month’s briefing. Weekly SST anomalies in the area of the Pacific that helps define El Niño and La Niña events, called the Nino3.4 region (see first image below), are now solidly in the neutral ENSO range, averaging -0.1ºC over the last four weeks.
Compared to last month, winds have also shifted from La Niña-like to a more neutral state.
Earlier this month, IRI and the National Oceanic and Atmospheric Administration’s Climate Prediction Center issued a Final La Niña Advisory, which makes official the end of the La Niña event.
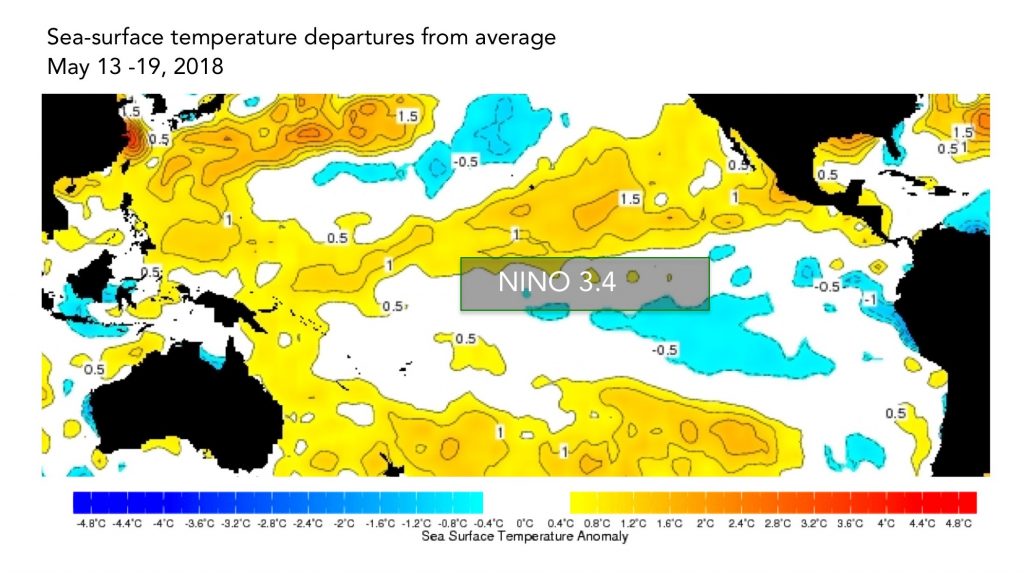
The sea-surface temperatures in the Nino3.4 region (approximated here) serve as a primary metric of El Niño and La Niña conditions. Data from the IRI Data Library. Image: IRI/Elisabeth Gawthrop
ENSO Forecasts
To predict ENSO conditions, computers model the SSTs in the Nino3.4 region over the next several months. The plume graph below shows the outputs of these models, some of which use equations based on our physical understanding of the system (called dynamical models), and some of which use statistics, based on the long record of historical observations. The current forecasts are still affected by what scientists call the spring predictability barrier – a time when it’s notoriously difficult for models to do a good job of forecasting upcoming conditions. Uncertainty for the forecasts this month is therefore high.
Similar to last month, the models in this month’s forecast predict SST anomalies in Nino3.4 to gradually warm through the year. The means of both types of models are now topping out around +0.8ºC by early 2019. Dynamical models are usually more bullish on El Niño than statistical models are, but, again similar to last month, the statistical models are the group calling for faster warming this year.
There has, however, been a slight slowdown in predicted SST warming compared to last month’s forecast. The mean of the statistical models reaches the +0.5ºC mark in the August-October season. In last month’s forecast, the statistical models reached this threshold in the July-September season.
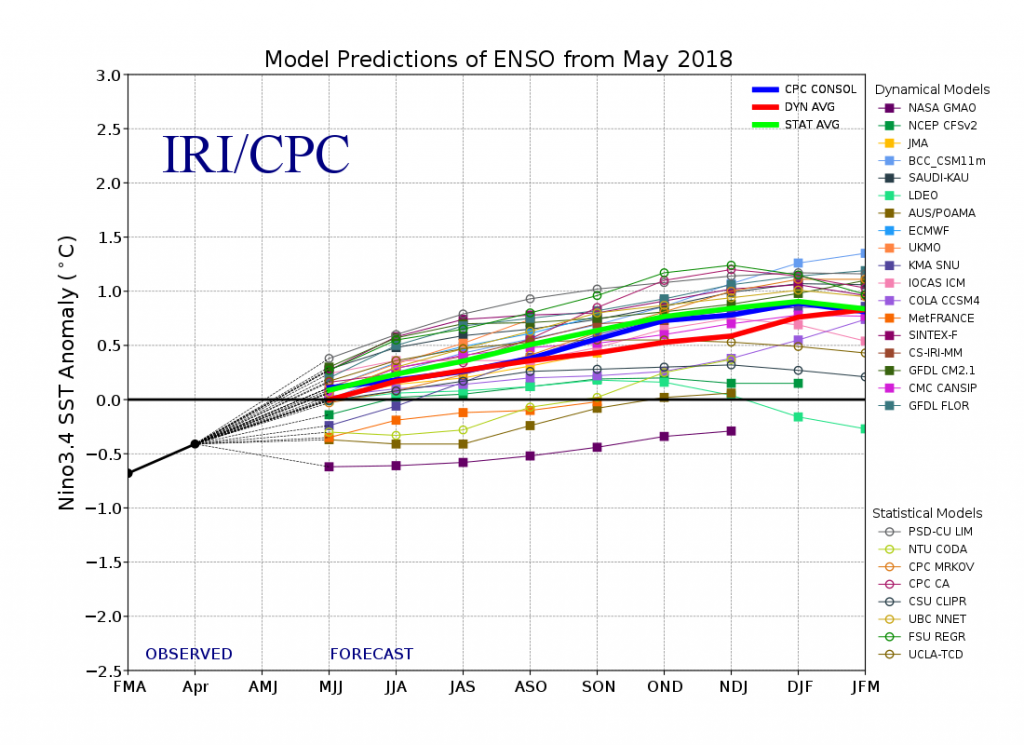
This graph shows forecasts made by dynamical and statistical models for SST in the Nino 3.4 region for nine overlapping 3-month periods. Note that the expected skills of the models, based on historical performance, are not equal to one another.
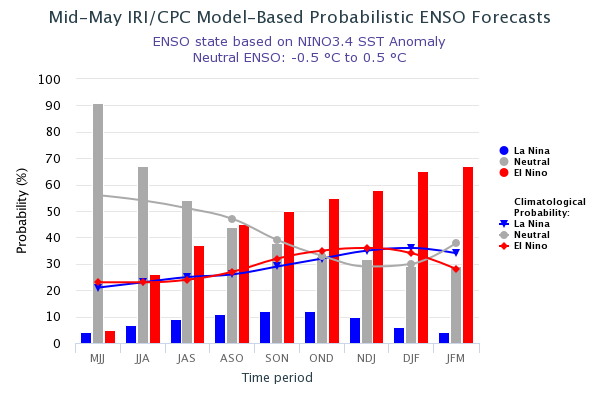
The IRI/CPC probabilistic ENSO forecast issued mid-May 2018. Note that bars indicate likelihood of El Niño occurring, not its potential strength. Unlike the official ENSO forecast issued at the beginning of each month, IRI and CPC issue this updated forecast based solely on model outputs. The official forecast, available at http://1.usa.gov/1j9gA8b, also incorporates human judgement.
Based on the model outputs, odds for neutral ENSO conditions dominate at 90% for the current May – July season. Neutral conditions remain the most likely ENSO state through the northern hemisphere summer. In the August – October season, El Niño edges out neutral as the most likely condition according to models.
ENSO in context: Resource page on climate variability
Forecasters from IRI and CPC do not have much confidence in the forecasts at this time of year, due to the aforementioned spring predictability barrier. They have moderated the chances for El Niño conditions in the official probabilistic forecast issued by CPC and IRI in early May. While the forecasts indicate similar overall trends in ENSO probabilities, the early-May forecast is more conservative in predicting El Niño in the later months. This early-May forecast uses human judgement in addition to model output, while the mid-month forecast relies solely on model output. More on the difference between these forecasts in this IRI Medium post.
IRI’s Global Seasonal Forecasts
Each month, IRI issues seasonal climate forecasts for the entire globe. These forecasts take into account the latest model outputs and indicate which areas are more likely to see above- or below-normal temperatures and precipitation.
The latest #IRIforecast for seasonal precipitation in the upcoming months.
Some strong sea surface temperature anomalies NOT related to ENSO are influencing this forecast, says IRI’s Tony Barnston. pic.twitter.com/y4LWxQw0l9
— IRI (@climatesociety) May 18, 2018
For the upcoming June – August season, odds are at least moderately tipped in favor of below-normal rainfall across Indonesia, Central Asia, eastern Australia, the northwestern U.S., Central America, the Caribbean and portions of South America. Areas with some chance of above normal precipitation include southern Africa, eastern Russia, eastern India and the Himalayas.
All forecast maps, including temperature in addition to precipitation, and including a description of the methodologies, are available on our seasonal forecast page.
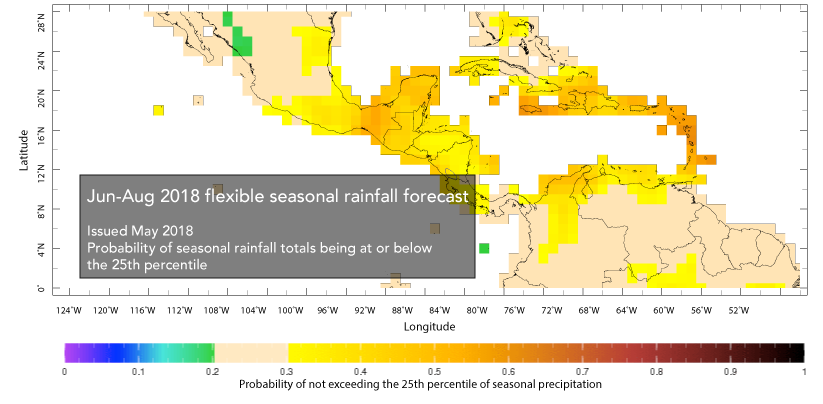
An alternative format for viewing IRI seasonal forecasts is also available in our Data Library. The Flexible Forecast Maproom allows for users to select specific thresholds (as a percentile or in millimeters) and see the probability that that threshold will be exceeded (or not exceeded). For example, the image below was created with the maproom, with the 25th percentile used as the threshold and the probability based on not exceeding that mark. From this figure, we can see that several areas in the region have ~50% or greater odds of being in the lower 25th percentile of rainfall for the season.
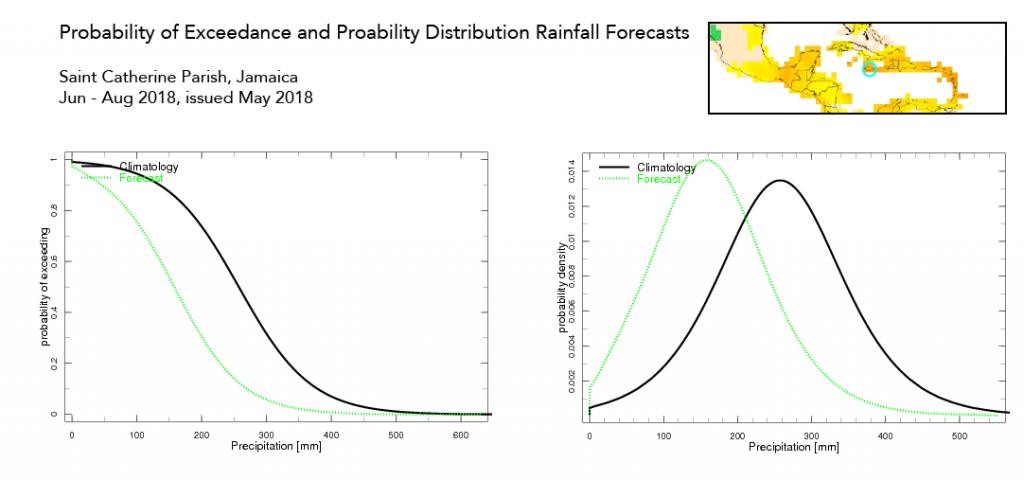
For more technical users, the Flexible Forecast Maproom also provides the ability to click on a specific point to see the details of the forecast in that area. Below are the probability-based forecasts for Saint Catherine parish in Jamaica, for the same period as shown above.
Learn more about El Niño and La Niña on our ENSO resources page, and sign up here to get notified when the next forecast is issued. In the meantime, check out #IRIforecast.
You must be logged in to post a comment.