June Climate Briefing: El Niño Odds Increasing, Watch Issued
Read our ENSO Essentials & Impacts pages for more about El Niño and La Niña.
Tony Barnston provides an overview of the briefing:
What’s New
Sea-surface temperature (SST) anomalies in the equatorial Pacific Ocean have continued to warm since last month’s briefing. Weekly SST anomalies in the area of the Pacific that helps define El Niño and La Niña events, called the Nino3.4 region (see first image below), are now solidly in the neutral ENSO range, averaging +0.03ºC over the last four weeks.
Subsurface waters indicate an El Niño could be imminent, and some tradewinds are also in line with the development of El Niño. But for much of the equatorial Pacific region tradewinds are still going strong. For an El Niño to emerge, the weakening or reversal of tradewinds would need to become more widespread.
Earlier this month, IRI and the National Oceanic and Atmospheric Administration’s Climate Prediction Center issued an El Niño Watch, which indicates conditions could favor development of El Niño in the next six months.
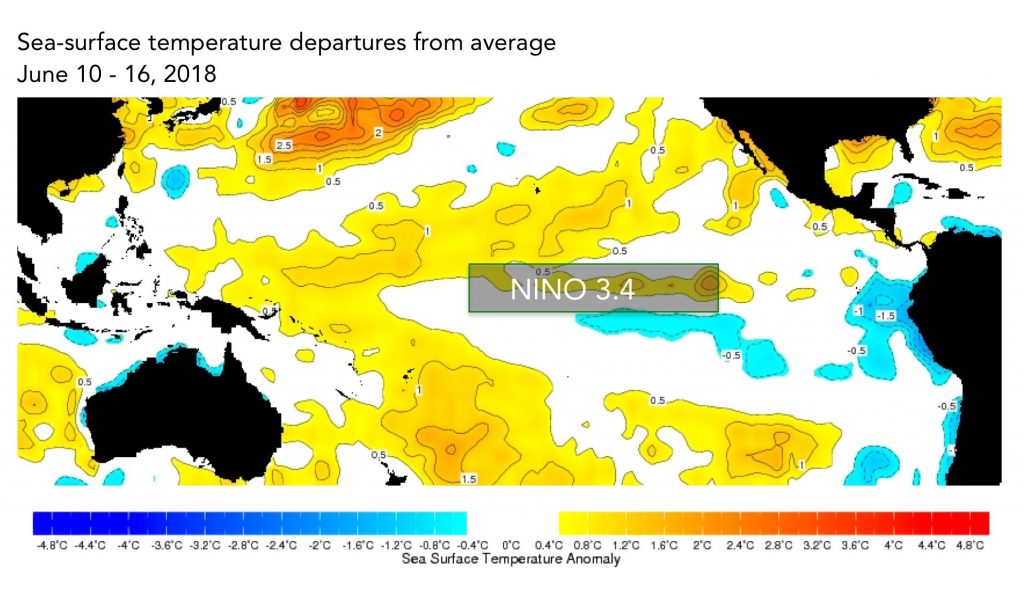
The sea-surface temperatures in the Nino3.4 region (approximated here) serve as a primary metric of El Niño and La Niña conditions. Data from the IRI Data Library. Image: IRI/Elisabeth Gawthrop
ENSO Forecasts
To predict ENSO conditions, computers model the SSTs in the Nino3.4 region over the next several months. The plume graph below shows the outputs of these models, some of which use equations based on our physical understanding of the system (called dynamical models), and some of which use statistics, based on the long record of historical observations. The current forecasts come at the tail end of what scientists call the spring predictability barrier – a time when it’s notoriously difficult for models to do a good job of forecasting upcoming conditions.
Over the last several months, models’ predictions of the SST anomalies in Nino3.4 have become warmer and warmer. While for the last few months the statistical models were more bullish on El Niño than the dynamical models, the dynamical models are now calling for slightly faster warming. The mean of the dynamical models nearly reaches the +0.5ºC threshold in the July-September season, while the statistical model mean reaches that mark in the August-October season. The means of the statistical and dynamical models both top out between +0.9ºC and +1.0ºC in early 2019.
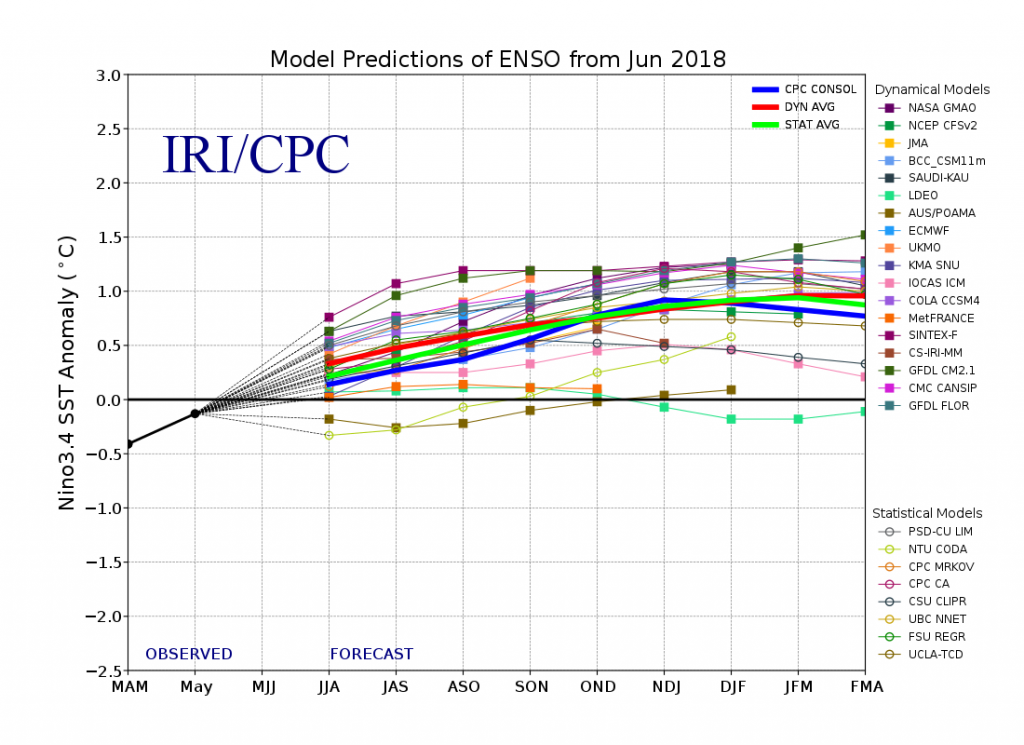
This graph shows forecasts made by dynamical and statistical models for SST in the Nino 3.4 region for nine overlapping 3-month periods. Note that the expected skills of the models, based on historical performance, are not equal to one another.
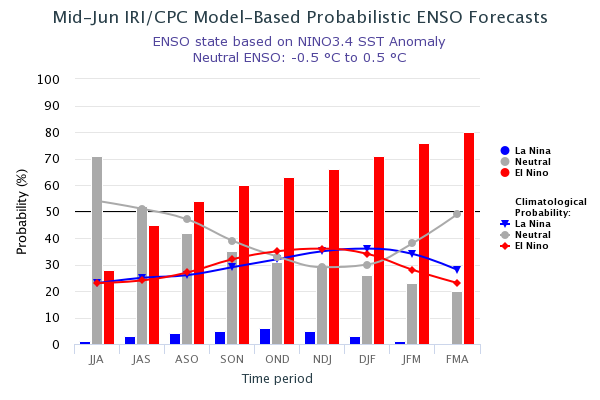
The IRI/CPC probabilistic ENSO forecast issued mid-June 2018. Note that bars indicate likelihood of El Niño occurring, not its potential strength. Unlike the official ENSO forecast issued at the beginning of each month, IRI and CPC issue this updated forecast based solely on model outputs. The official forecast, available at http://1.usa.gov/1j9gA8b, also incorporates human judgement.
Based on the model outputs, odds for neutral ENSO conditions to remain are around 70% for the current June-August season. In the August-October season, El Niño edges out neutral as the most likely condition according to models. El Niño’s probability continues to increase through the end of the forecast period, reaching 80% in the February-April 2019 season.
ENSO in context: Resource page on climate variability
Confidence in the forecast is higher than last month, but we’re still at the end of the aforementioned spring predictability barrier. And, although the probabilities are high towards the end of the forecast period, they do not give an indication of the potential strength of the event. Barnston says it’s too uncertain to say what an El Niño’s strength might be at this point, given the spread from neutral to moderate El Niño conditions that the models are predicting.
Forecasters have moderated the chances for El Niño conditions in the official probabilistic forecast issued by CPC and IRI in early June. While the forecasts indicate similar overall trends in ENSO probabilities, the early-June forecast is more conservative in predicting El Niño in the later months. This early-June forecast uses human judgement in addition to model output, while the mid-month forecast relies solely on model output. More on the difference between these forecasts in this IRI Medium post.
IRI’s Global Seasonal Forecasts
Each month, IRI issues seasonal climate forecasts for the entire globe. These forecasts take into account the latest model outputs and indicate which areas are more likely to see above- or below-normal temperatures and precipitation.
Seasonal forecasts for rainfall. Many typical #elniño signatures. Oddball: Sahel shows incr prob. for above normal, which doesn't match El Niño expectation. Something else forcing it, but Tony + our Alessandra Giannini not yet certain what that can be. Thoughts? #IRIforecast pic.twitter.com/h0Wybd1gZd
— IRI (@climatesociety) June 21, 2018
For the upcoming July – September season, odds are strongly tipped in favor of below-normal rainfall across much of Indonesia, Central America and the Caribbean. Southern and eastern Australia, Japan and parts of western Canada and Alaska show moderate odds for below-normal rainfall. Areas with some chance of above normal precipitation include South Africa and parts of the western and central Sahel.
All forecast maps, including temperature in addition to precipitation, and including a description of the methodologies, are available on our seasonal forecast page.
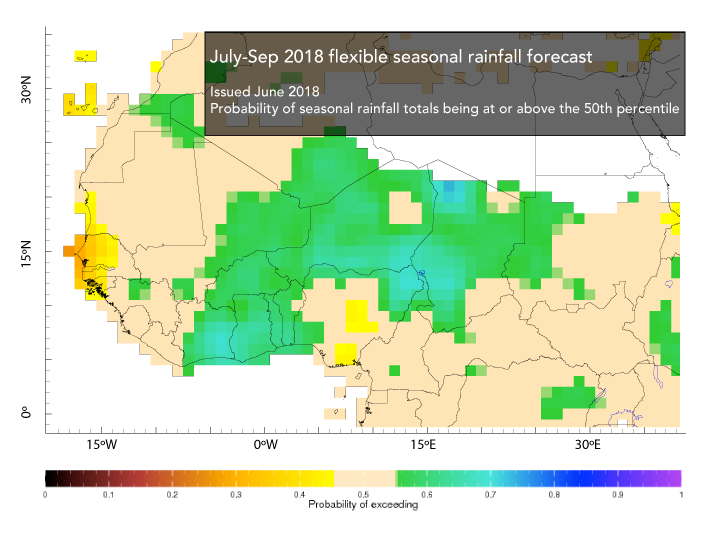
Most of these forecasted conditions are typical of an El Niño pattern, but the Sahel forecast is more of a mystery, said Barnston, in terms of which SST anomalies may be leading to the wetter-than-average forecast. Here’s a close up of that region using an alternative format for viewing IRI seasonal forecasts (and also available in our Data Library). The Flexible Forecast Maproom allows for users to select specific thresholds (as a percentile or in millimeters) and see the probability that that threshold will be exceeded (or not exceeded). For example, the image below was created with the maproom, with the 50th percentile used as the threshold and the probability based on exceeding that mark. From this figure, we can see that some areas in the region have ~70% chance of receiving rainfall above the 50th percentile for the season.
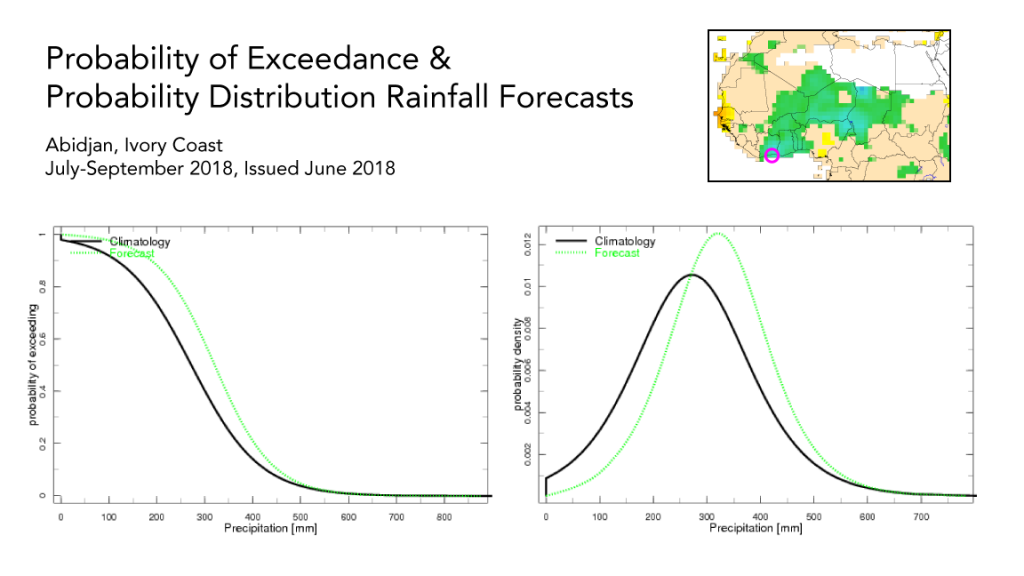
For more technical users, the Flexible Forecast Maproom also provides the ability to click on a specific point to see the details of the forecast in that area. Below are the probability-based forecasts for the city of Abidjan in Ivory Coast, for the same period as shown above, indicating likelihood for above-average rainfall over the coming months. The city has recently had heavy rainfall, leading to deadly floods.
Learn more about El Niño and La Niña on our ENSO resources page, and sign up here to get notified when the next forecast is issued. In the meantime, check out #IRIforecast.
You must be logged in to post a comment.