June Climate Briefing: El Niño Certainty Increases
From the June climate briefing, given by IRI’s Chief Forecaster Tony Barnston:
Tony Barnston provides an overview of the briefing
The IRI/CPC probabilistic ENSO forecast issued mid-June 2015. Note that bars indicate likelihood of El Niño occurring, not its potential strength. Unlike the official ENSO forecast issued at the beginning of each month, IRI and CPC issue this updated forecast based solely on model outputs. The official forecast, available at http://1.usa.gov/1j9gA8b, also incorporates human judgement.
Changes from last month’s briefing
Over the last month, the ongoing El Niño in the east-central Pacific has intensified to moderate strength. There is now a 99% chance of El Niño for the June-August season, and chances stay at or above 90% through the end of the year. These odds only indicate the chance of at least weak El Niño conditions occurring, with no indication of strength. Scientists are more certain, however, than last month that El Niño conditions will persist at at least the moderate level. The El Niño advisory issued in March by the National Oceanic and Atmospheric Administration’s Climate Prediction Center and IRI is still in effect.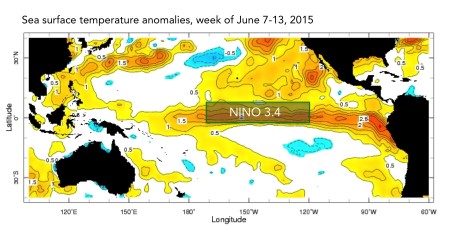
The sea-surface temperature (SST) anomaly in the Nino3.4 region (see second image) has hovered around 1.2-1.4ºC above average for the last several weeks, well above the 0.5ºC mark considered to be a threshold indicator of El Niño conditions. The last time weekly Nino3.4 SST anomalies were at this level was in January of 2010. To predict El Niño, computers model the SSTs in this region over the next several months. The third image shows the outputs of these models, some of which use our physical understanding of the system (called dynamical models), and some of which used statistics, based on the long record of historical observations.
The mean of the SST models calls for a moderate to strong El Niño, with the dynamical models predicting an event on the stronger side and statistical models predicting a more moderate event. Last month, some models were calling for neutral-to-weak El Niño conditions, but all models are now predicting at least a weak El Niño, with most models indicating a moderate or strong El Niño. Likewise, the spread in the models last month was larger, with nearly a 3ºC difference between the lowest and highest model predictions. This month the spread is around 2ºC. While this variation is still significant, the reduced spread signifies in the decrease in forecast uncertainty as we near the end of the so-called spring predictability barrier.
The following graph shows forecasts made by dynamical and statistical models for SST in the Nino 3.4 region for nine overlapping 3-month periods. Note that the expected skills of the models, based on historical performance, are not equal to one another.
Effects of El Niño on global seasonal forecasts
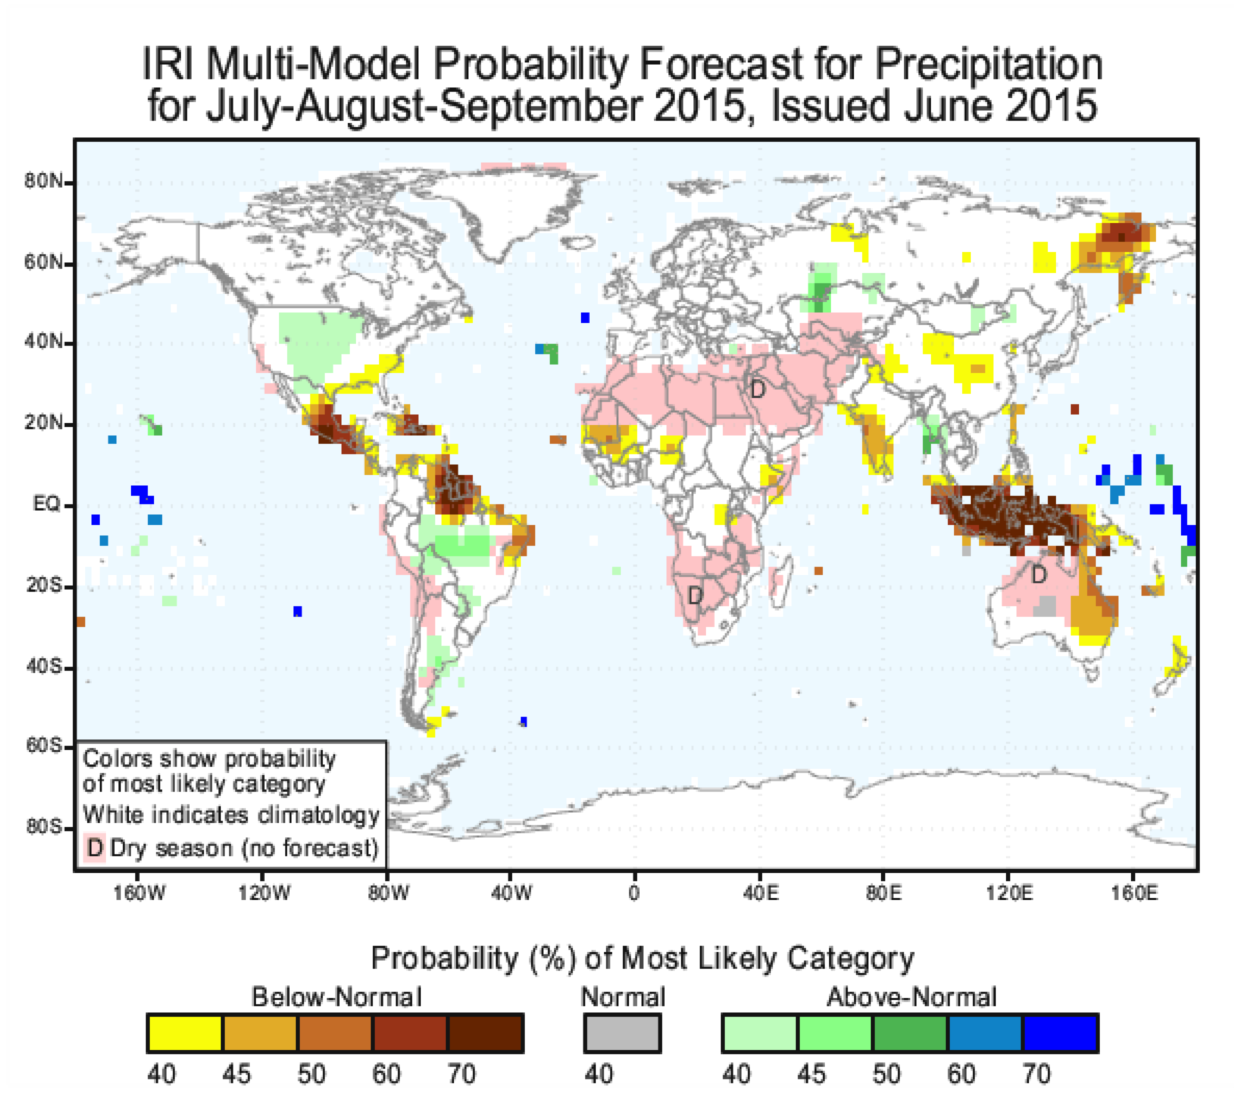 Each month, IRI issues seasonal climate forecasts for the entire globe. These forecasts take into account the latest ENSO SST projections and indicate which areas are more likely to see above or below normal temperatures and rainfall. For the July-September period, the forecast continues to show a strong likelihood of drier-than-normal conditions over Indonesia, northeastern Russia, northeastern South America and parts of Central America and the Caribbean (image right). There are also increased odds for drier-than-normal conditions in parts of western Africa, central China, southwestern India and eastern Australia. Wetter-than-average conditions are predicted to be more likely in central Brazil, northern Bolivia, central Argentina and the Central Plains of the United States.
El Niño and the California Drought
While wetter-than-normal conditions in California are widely talked about as a typical El Niño impact, this signal is typically strongest in the January-March season (see images below). If the El Niño persists until then, there may be some relief from drought conditions. That relief may not come without consequence, however, as drenching rains on dry soil increase the risk of mudslides. Visit our Data Library for interactive maps indicating probability of above- or below-average rainfall across the globe.
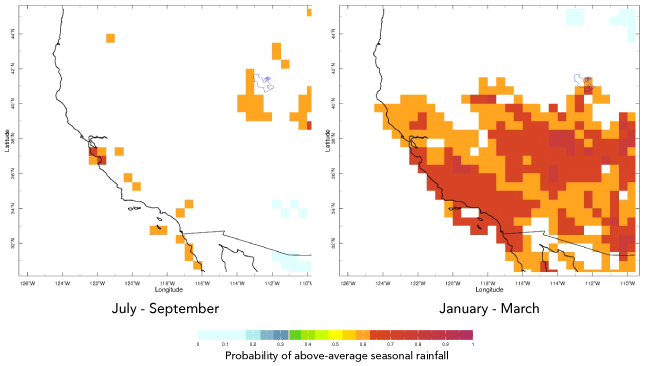
Historical probability of above-average precipitation in the western United States during El Niño events. A value of 0.7 for a grid point in a given season indicates that in 7 out of 10 years with El Niño conditions during the same season, precipitation fell in the above-average category. Only data points with >90% significance are shown. See the IRI Data Library for more explanation and to use the interactive map for historical probabilities of precipitation during ENSO events.
Learn more about El Niño on our ENSO resources page, and sign up here to get notified when the next forecast is issued. In the meantime, check out #IRIforecast or use #ENSOQandA on Twitter to ask your El Niño questions.
You must be logged in to post a comment.