July Climate Briefing: Waiting for the Winds to Change
Read our ENSO Essentials & Impacts pages for more about El Niño.
Tony Barnston provides an overview of the briefing
Neutral conditions remain in the central equatorial region of the Pacific Ocean that define El Niño and La Niña events, called the Nino3.4 region. Recent weekly sea-surface temperature anomalies dipped just below the -0.5º threshold used to define La Niña, but those anomalies will have to persist before an update is made in the ENSO alert system. While ocean temperatures are indicating a La Niña event could be imminent, atmospheric conditions consistent with La Niña (i.e. stronger-than-average trade winds) are not yet present. The La Niña watch issued by the National Oceanic and Atmospheric Administration’s Climate Prediction Center in June is still in effect.
Changes from last month’s briefing
In June, the monthly average sea-surface temperature anomaly in the Nino3.4 region dipped below the 0ºC mark for the first time since March of 2014. At -0.12ºC below average, the temperature was squarely within ENSO-neutral conditions. In the last several weeks, the weekly-averaged sea-surface temperatures have dropped further, hovering around the -0.5ºC mark. See the latest SST measurements in the first image below. [Note: For many reasons outlined in this NOAA blog post, comparison of SSTs between datasets (and sometimes even within the same dataset!) should be cautious, largely due to variation in data collection methods and resolution of the datasets. Further, the dataset used for the above statistics (called OISSTv2) is not the one used in NOAA’s records for official peak strength (called ERSSTv4), though OISSTv2 is the one used in initializing models.]


To predict El Niño, computers model the SSTs in the Nino3.4 region over the next several months. The graph in the second image of the gallery shows the outputs of these models, some of which use equations based on our physical understanding of the system (called dynamical models), and some of which use statistics, based on the long record of historical observations.
The dynamical model mean calls for a weaker La Niña event compared to last month’s forecast, while the statistical model mean, forecasting a borderline La Niña event, is similar to last month’s statistical forecast. The model means are within about 0.25ºC of each other — the closest agreement they’ve had since March of this year. The spread of the model outputs overall is narrower than the June forecast’s spread, but still has a range of 2.0ºC.
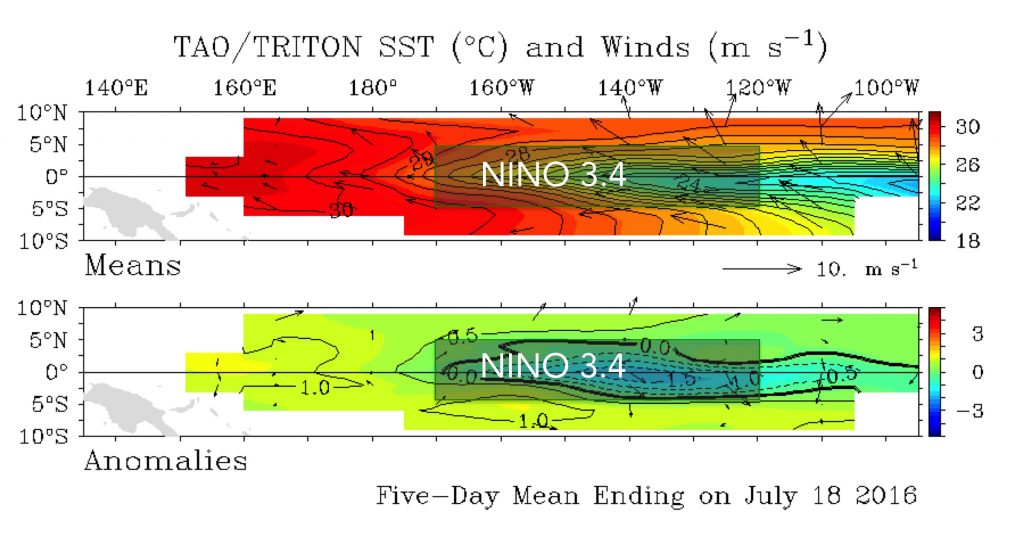
Sea-surface temperature and wind means and anomalies in the equatorial Pacific for the period July 14-18. In the Nino3.4 region, SSTs are overall below average, while zonal winds are close to average. Image: NOAA.
Based on these model outputs, chances for La Niña development in the latter half of 2016 are down slightly from last month, with odds topping out at just under 60% for the December-January-February period (see third graph in gallery above).
The probabilistic forecast issued by CPC and IRI in early July shows slightly higher odds for La Niña conditions. This early-July forecast uses human judgement in addition to model output, while the mid-July forecast relies solely on model output.
Effects of El Niño on global seasonal forecasts
Each month, IRI issues seasonal climate forecasts for the entire globe. These forecasts take into account the latest sea-surface temperature projections and indicate which areas are more likely to see above- or below-normal temperatures and rainfall.


For the upcoming August-October period, the forecast shows some likelihood of drier-than-normal conditions over areas of the southeastern and northwestern United States (first image in gallery above, click to enlarge). The forecast also shows a slightly elevated chance of above-average precipitation in Indonesia.
El Niño in context: Resource page on climate variability
The impacts listed above are specifically for the August-October season. For the later seasons, see forecast maps in the image gallery and on our seasonal forecast page.
Learn more about La Niña on our ENSO resources page, and sign up here to get notified when the next forecast is issued. In the meantime, check out #IRIforecast or use #ENSOQandA on Twitter to ask your La Niña questions.
You must be logged in to post a comment.