February Climate Briefing: Unique El Niño Slowly Weakening
Read our ENSO Essentials & Impacts pages for more about El Niño.
The peak of the ongoing El Niño occurred in November 2015, but the event remains in “strong” category, and is likely to stay at moderate strength through April. The El Niño signal is still tipping the odds for certain climate impacts in some regions for the next several months (see seasonal forecasts near end of post).
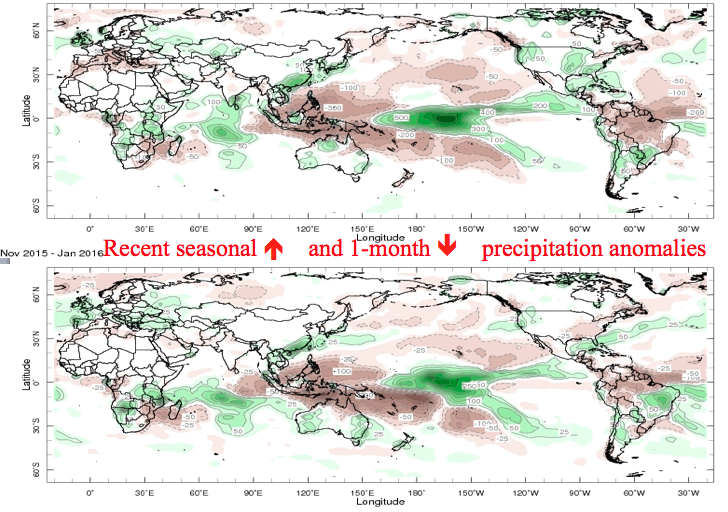
The top image shows the precipitation anomalies from Nov 2015 – Jan 2016 (mm/season). The bottom shows precipitation anomalies for Jan 2016 only (mm/month). The anomalies are compared to the 1971-2000 base period.
This El Niño has been unique from past strong El Niño events both in its climate features in the Pacific as well as in the way its impacts have manifested around the world, said Anthony Barnston, IRI’s Chief Forecaster. In the Pacific, sea-surface temperatures in the Nino3.4 region, which officially define the El Niño event, have been similar to those in the strong 1982-83 and 1997-98 events.
The temperature pattern in the surrounding waters, however, has been a little different. In the western Pacific, temperatures during an El Niño are often cooler than average, but this year they have overall been more average. Additionally, the warm surface waters in the central equatorial Pacific typically extend to the eastern side of the basin, approaching the South American coast. During this event, waters in that part of the ocean were well above average during the Northern Hemisphere fall, but have since become only somewhat above average.
Because of these differences in the temperatures outside of the Nino3.4 region, the usual gradient of temperature between cool in the western Pacific and warm in the east is not as strong as seen in previous major El Niño events. Though scientists can’t be sure exactly how this may have influenced El Niño’s climate impacts, it may have contributed to the atmospheric components of this El Niño that have also played out a little differently. The El Niño-related convection (i.e. rain storms) along the equator in the central Pacific has been occurring a little more north than is typical for El Niño, and the strongest convection hasn’t stretched as far to the east as during the 1997-98 El Niño (see image below).
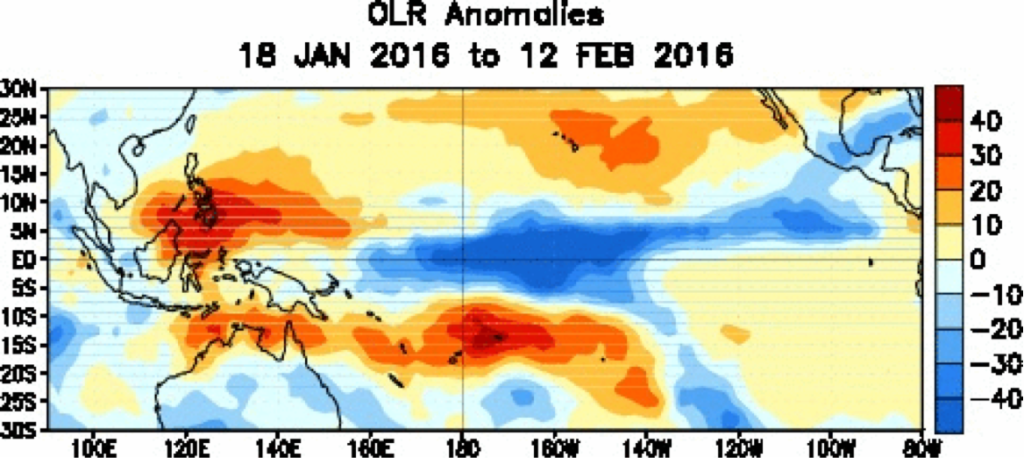
Outgoing longwave radiation is displayed, with blue tones indicating more convection, and orange tones indicating less convection.
This equatorial convection is thought to be the major contributor to setting in motion the atmospheric processes that influence climate around the world during El Niño, so changes from the usual pattern may also be altering the typical climate impacts. A few “anomalies of the anomalies,” as Barnston put it, include more rain than normal in Namibia and less rain than a typical El Niño year in Texas and the southwestern United States.
Why this unique El Niño has transpired the way it has is a research question on the minds of many scientists. But due to the complexity of the climate system, it’s not one that’s likely to be quickly answered.
Changes from last month’s briefing
Last week, sea-surface temperatures in the Nino3.4 region (see first image in second gallery) were 2.5ºC above average. The SST anomaly for the month of January was +2.60ºC (December was 2.82ºC, November was 2.95ºC). The highest weekly Nino3.4 SST value recorded was 3.1ºC in mid-November. [Note: For many reasons outlined in this NOAA blog post, comparison of SSTs between datasets (and sometimes even within the same dataset!) should be cautious, largely due to variation in data collection methods and resolution of the datasets. Further, the dataset used for the above statistics (called OISSTv2) is not the one used in NOAA’s records for official peak strength (called ERSSTv4), though OISSTv2 is the one used in initializing models.]


To predict El Niño, computers model the SSTs in the Nino3.4 region over the next several months. The graph in the second image of the second gallery shows the outputs of these models, some of which use equations based on our physical understanding of the system (called dynamical models), and some of which used statistics, based on the long record of historical observations.
The models show a similar output to that of last month’s forecast. The means of both the dynamical and statistical models call for the El Niño event to continue to weaken, and they are largely in agreement for the next three or so months. They project the event will stay at or above the +1.5ºC “strong” El Niño threshold through the February-April season, and above the +0.5ºC “weak” El Niño threshold through the April-June season. Looking to the Northern Hemisphere autumn, both dynamical and statistical models agree on a borderline La Niña state (-0.5ºC) by October-December season, but the dynamical models call for a slightly faster swing into the such conditions, while the statistical models are a little more gradual.
B/c of Rossby waves & our understanding of ENSO, spring prediction barrier a little less significant than other yrs – Barnston #IRIforecast
— IRI (@climatesociety) February 18, 2016
Though models’ ability to predict past June tends to be weak, there is more certainty coming out of a strong El Niño year due to scientists’ understanding of the physical processes of El Niño Southern Oscillation. Nonetheless, long-range forecasts carry higher uncertainty than short-term. El Niño conditions are unlikely for the latter half of 2016, but it’s not possible to determine yet whether neutral or La Niña conditions will prevail.
According to model predictions, the probability that El Niño will continue, at least at a weak level, remains near 100% through the March-May season. The probability of El Niño then drops off quickly. Odds of neutral conditions (60%) are double those of El Niño conditions (30%) for the May-July season. For the final season in the forecast, October-December, the odds of La Niña conditions just top 50%.
The El Niño advisory issued in March 2015 by the National Oceanic and Atmospheric Administration’s Climate Prediction Center and IRI is still in effect.
Effects of El Niño on global seasonal forecasts
Each month, IRI issues seasonal climate forecasts for the entire globe. These forecasts take into account the latest ENSO SST projections and indicate which areas are more likely to see above- or below-normal temperatures and rainfall.


For the upcoming March-May period, the forecast shows a strong likelihood of drier-than-normal conditions over areas of northern South America and southeast Asia (first image in gallery above, click to enlarge). There are also increased odds for drier-than-normal conditions in southern Africa, west-central Africa, western Alaska, parts of Canada and the northern US, Colombia, southern India and Sri Lanka. The southern US, eastern Caribbean, Ecuador, southern Brazil, central-southwest Asia and northern China have increased chances of above-average precipitation.
El Niño in context: Resource page on climate variability
The impacts listed above are specifically for the March-May season. Some of these impacts are predicted to persist in the following seasons, but some areas see different impacts in the other seasonal windows. By the June-August season, the ENSO-neutral conditions expected in the Pacific Ocean lend little signal for seasonal forecast prediction. See forecast maps in the image gallery and on our seasonal forecast page.
Learn more about El Niño on our ENSO resources page, and sign up here to get notified when the next forecast is issued. In the meantime, check out #IRIforecast or use #ENSOQandA on Twitter to ask your El Niño questions.
You must be logged in to post a comment.