April Climate Briefing: El Niño Lingers, La Niña Looms
Read our ENSO Essentials & Impacts pages for more about El Niño.
Tony Barnston provides an overview of the briefing
Over a year ago, the National Oceanic and Atmospheric Administration’s Climate Prediction Center and IRI jointly issued an El Niño advisory, indicating El Niño conditions had arrived and were expected to continue. That advisory is still in effect, but this month CPC/IRI also issued a La Niña watch, indicating that conditions are favorable for a La Niña to develop in the next six months.
Does this mean scientists expect an El Niño and La Niña to occur simultaneously? No, that would be inherently impossible. The cooler-than-average sea-surface temperatures in the Nino3.4 region of the central equatorial Pacific Ocean that characterize La Niña are by definition the opposite of El Niño conditions. But forecasters expect the current El Niño, though still in the moderate range, to dissipate in the next one to two months and set up the possibility for La Niña conditions to take over. Past strong El Niño events have often been followed by La Niña conditions, but not exclusively. The below graph, from Climate.gov, shows the Nino3.4 temperatures during and after moderate and strong El Niño events. Of the three previous strongest El Niño events, two (72/73 and 97/98) were quickly followed by strong La Niña events. After the other strong El Niño event (82/83), conditions were on the cool side of neutral for about a year, followed by a moderate La Niña.
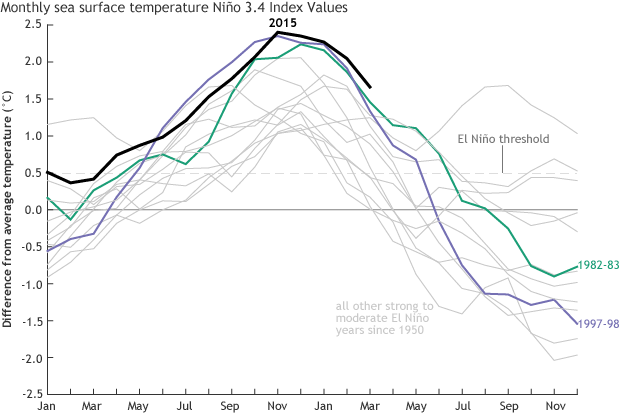
Monthly sea-surface temperature in the Niño 3.4 region of the tropical Pacific compared to the long-term average for all moderate-to-strong El Niño years since 1950, showing how 2015/16 (black line) compares to other strong events. Climate.gov graph based on ERSSTv4 temperature data.
Changes from last month’s briefing
In March, the monthly average sea-surface temperatures in the Nino3.4 region of the central equatorial Pacific Ocean dipped below +2.0ºC above average for the first time since September 2015. At 1.64ºC above average, the figure was still above the 1.5ºC mark that scientists consider the threshold of a “strong” El Niño. During April, however, the weekly-averaged sea-surface temperatures have slipped below that threshold. See the latest measurements in the first image below. [Note: For many reasons outlined in this NOAA blog post, comparison of SSTs between datasets (and sometimes even within the same dataset!) should be cautious, largely due to variation in data collection methods and resolution of the datasets. Further, the dataset used for the above statistics (called OISSTv2) is not the one used in NOAA’s records for official peak strength (called ERSSTv4), though OISSTv2 is the one used in initializing models.]


To predict El Niño, computers model the SSTs in the Nino3.4 region over the next several months. The graph in the second image of the gallery shows the outputs of these models, some of which use equations based on our physical understanding of the system (called dynamical models), and some of which use statistics, based on the long record of historical observations.
The means of the models show a similar output to that of last month’s forecast, though the dynamical models are a bit cooler for the latter months of 2016. The spread of the models has notably decreased since last month, indicating less uncertainty. This is likely due to some error corrections in some models made in the last month (details in this PowerPoint and this technical implementation notice). Both the dynamical and statistical models call for the El Niño event to continue to weaken, with the dynamical models calling for ENSO-neutral conditions by the May-June-July season and the statistical models entering neutral conditions at a slight lag. Looking to the Northern Hemisphere autumn, dynamical models show a weak La Niña state (-0.5ºC) by the July-August-September season and continuing through the end of the year. The statistical models don’t quite reach the La Niña threshold, but come close for the October-November-December season and the seasons that follow.
For the first time since July 2015, the model predictions for the current season do not indicate a 100% chance of El Niño conditions. For this month’s forecast, the probability that El Niño will continue, at least at a weak level, dropped to around 75% for the current April-June season. The probability of El Niño then plummets to approximately 20% for the May-July season, as chances for neutral conditions dominate. La Niña takes over as the most likely scenario (just over 50% chance) for the August-October season. For the final months of 2016, the odds of La Niña conditions approach 60%.
Effects of El Niño on global seasonal forecasts
Each month, IRI issues seasonal climate forecasts for the entire globe. These forecasts take into account the latest sea-surface temperature projections and indicate which areas are more likely to see above- or below-normal temperatures and rainfall.


For the upcoming May-July period, the forecast shows a strong likelihood of drier-than-normal conditions over areas of northern South America and the Philippines (first image in gallery above, click to enlarge). The forecast shows a high chance of above-average precipitation in southern Brazil. Alaska, the southern US, coastal Ecuador, the eastern Caribbean, western Turkey and parts of Indonesia show a slightly elevated chance of above-average precipitation. Other areas of Indonesia show a slightly elevated chance of below-average precipitation, as do parts of Russia.
El Niño in context: Resource page on climate variability
The impacts listed above are specifically for the May-July season. By the June-August season, the ENSO-neutral conditions expected in the Pacific Ocean lend little signal for seasonal forecast prediction. See forecast maps in the image gallery and on our seasonal forecast page.
Learn more about El Niño on our ENSO resources page, and sign up here to get notified when the next forecast is issued. In the meantime, check out #IRIforecast or use #ENSOQandA on Twitter to ask your El Niño questions.
You must be logged in to post a comment.