CCSR/IRI ENSO Forecast
CCSR/IRI Technical ENSO Update and Model-Based Probabilistic ENSO Forecast
Published: February 19, 2026
Note: The SST anomalies cited below refer to the OISSTv2 SST data set, and not ERSSTv5. OISSTv2 is often used for real-time analysis and model initialization, while ERSSTv5 is used for retrospective official ENSO diagnosis because it is more homogeneous over time, allowing for more accurate comparisons among ENSO events that are years apart. These two products may differ, particularly during ENSO events. The difference between the two datasets may be as much as 0.5 °C. Additionally in some years, the ERSSTv5 may tend to be cooler than OISSTv2 in the context of warming trends, because ERSSTv5 is expressed relative to a base period that is updated every 5 years, while the base period of OISSTv2 is updated every 10 years. In February 2021, both datasets were updated to reflect the 1991-2020 climatology period.
Recent and Current Conditions
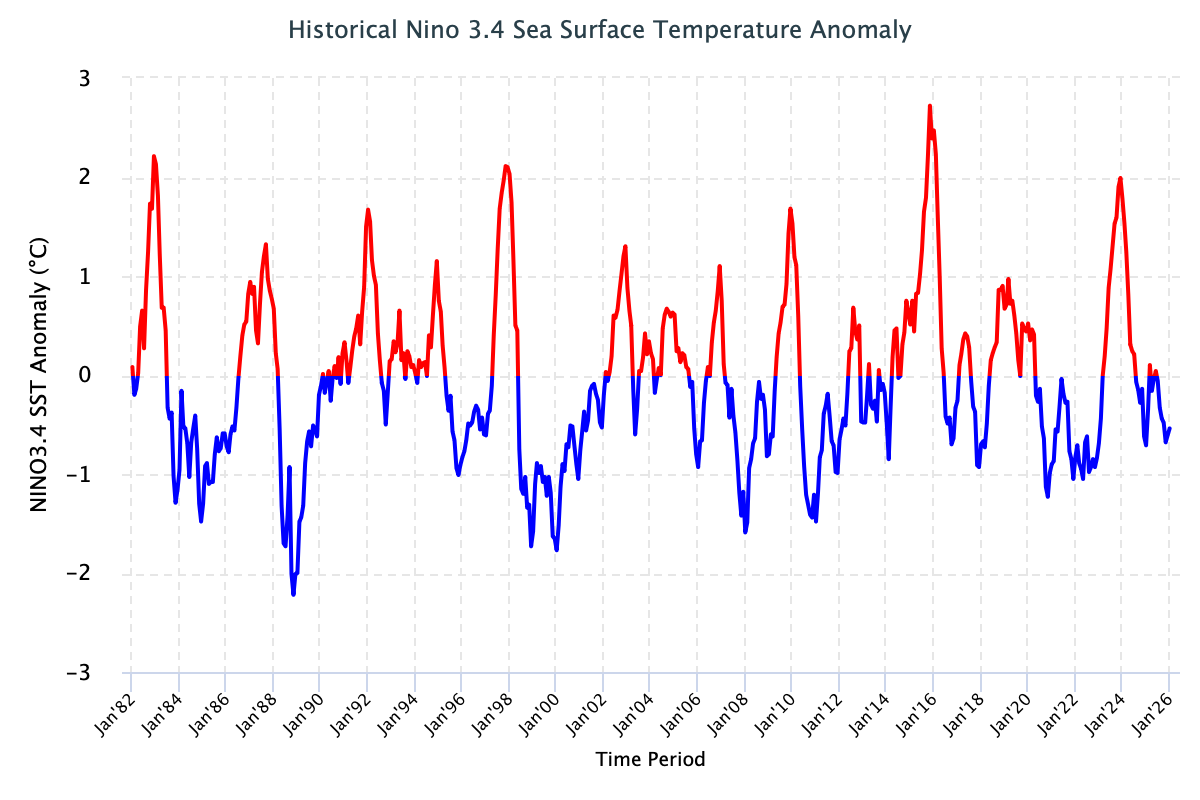
The observed SST anomaly in the NINO3.4 region during the Nov–Jan 2026 season was -0.61 °C, and for January 2026, it was -0.54 °C. The most recent weekly average (week centered on February 11, 2026) of the NINO3.4 index was -0.2 °C. These values indicate that Pacific sea-surface temperature anomalies have been experiencing weak but declining La Niña conditions across the equatorial Pacific. The CCSR/IRI’s definition of El Niño, requires that the monthly SST anomaly in the NINO3.4 region (5°S-5°N; 170°W-120°W) exceed +0.5 °C. Similarly, for La Niña, the anomaly must be -0.5 °C or colder.
By mid-February 2026, weak La Niña conditions had begun to decline slightly, as reflected in both atmospheric and oceanic variables. In January 2026, the Southern Oscillation Index (SOI) was +9.9, while the equatorial SOI was +0.5, indicating a weakening of the pressure gradient between the two regions. However, the most recent 30-day SOI value (ending 17 February 2026) remains within La Niña territory. Low-level winds (850 hPa) were near average across the east-central and eastern Pacific. Enhanced convection and increased rainfall were observed over parts of Indonesia, indicated by below-average outgoing longwave radiation (OLR), while suppressed convection and reduced precipitation prevailed around the Date Line, associated with above-average OLR, both typical of La Niña. However, above-average subsurface temperatures have strengthened across the Pacific and expanded farther eastward, with below-average subsurface temperatures confined to a small area in the far eastern Pacific. Although the warmer subsurface waters now dominate much of the Pacific, the warming itself remains relatively weak. Nevertheless, due to this subsurface warming and its eastward extent, the Niño 1+2 index has gradually increased over the past four weeks and currently stands at +0.7 for the week centered on 11 February 2026.
Taken together, these conditions indicate a gradual weakening of La Niña in the central-eastern equatorial Pacific, with signs of possible El Niño development in the subsurface.
It is worth noting that the Relative Oceanic Niño Index (RONI), which measures sea surface temperature anomalies in the eastern equatorial Pacific relative to the rest of the equatorial band, has consistently and increasingly exceeded the −0.5 La Niña threshold for the past several overlapping seasons. For Jul–Sep, Aug–Oct, Sep–Nov, Oct-Dec 2025, and Nov-Jan 2026 the RONI was -0.63, -0.77, -0.87, -0.93, and -0.97 °C respectively.
Expected Conditions
Note – Only models that produce a new ENSO prediction every month are considered in this statement.
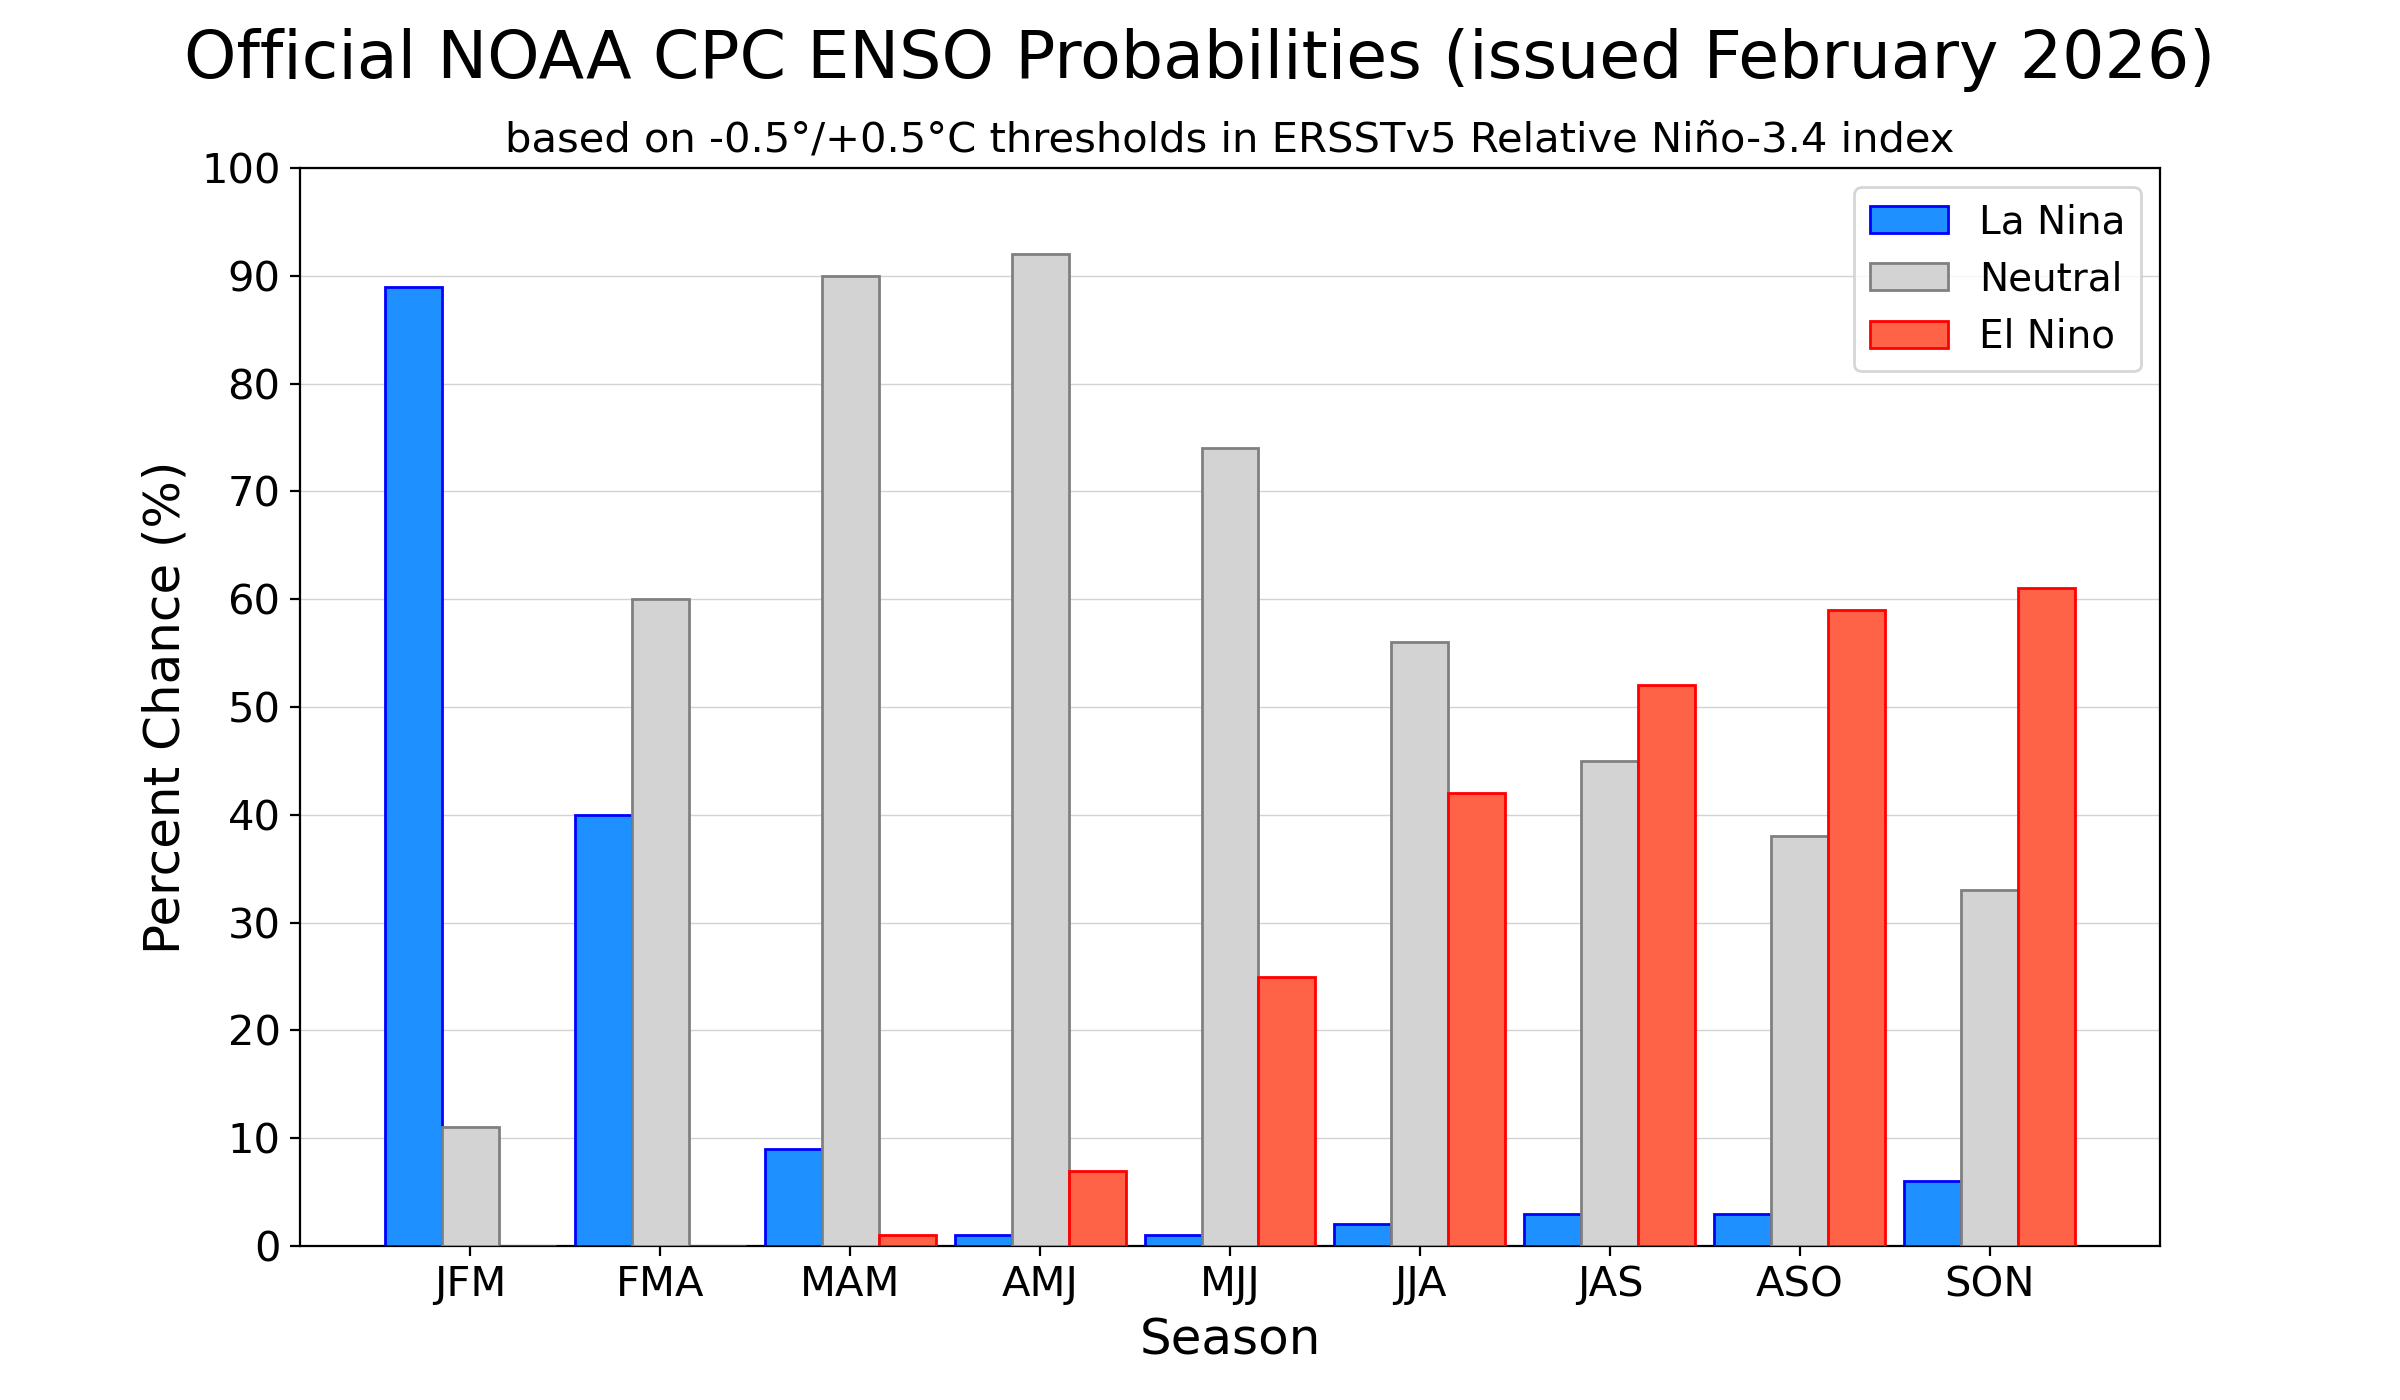
The El Niño/Southern Oscillation (ENSO) Diagnostic Discussion, released on 12 February 2026 by the Climate Prediction Center (CPC)/NCEP/NWS, maintained a “La Niña Advisory”, with a transition from La Niña to ENSO-neutral expected in February-April 2026 (60% chance), likely persisting through the Northern Hemisphere summer (56% chance in June-August 2026).
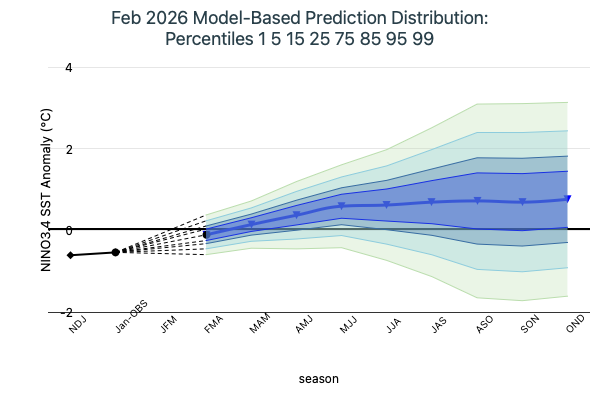
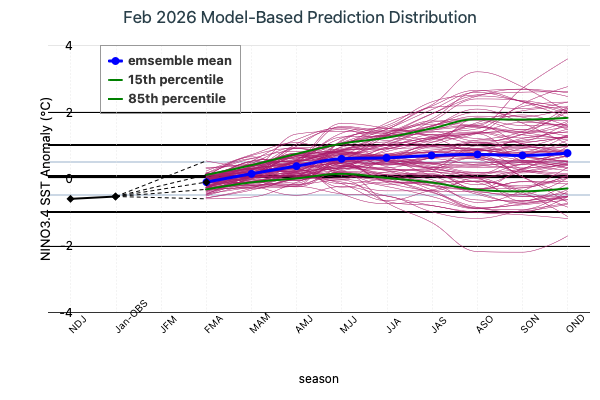
The latest set of ENSO prediction models from mid-February 2026 is now available in the CCSR/ IRI ENSO prediction plume. These are used to assess the probabilities of the three ENSO categories by using the average value of the NINO3.4 SST anomaly predictions from all models in the plume, equally weighted. A standard Gaussian error is imposed over that averaged forecast, with its width determined by an estimate of overall expected model skill for the season of the year and the lead time. Higher skill results in a relatively narrower error distribution, while low skill results in an error distribution with width approaching that of the historical observed distribution.
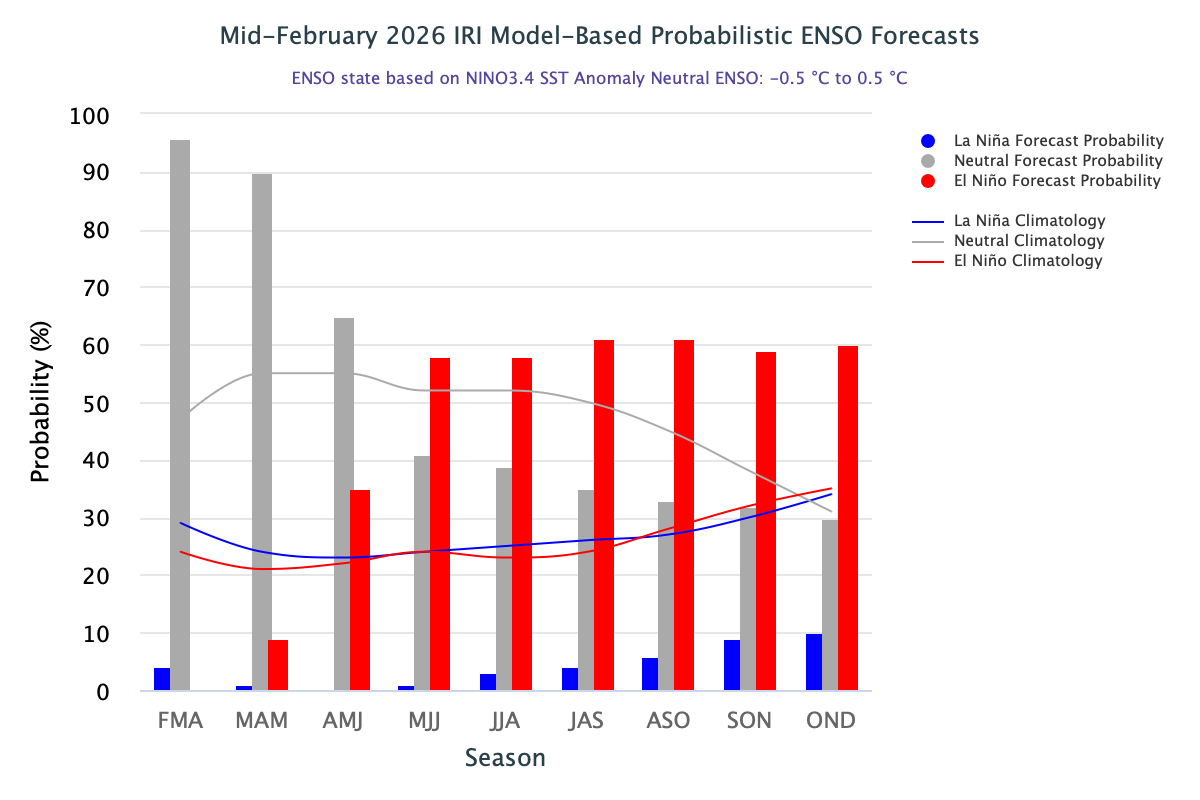
According to the February 2026 CCSR/IRI ENSO plume forecast, ENSO-neutral conditions are favored for February–April (FMA) 2026, with a 96% probability. In contrast, La Niña has only a slim 4% chance of persisting. ENSO-neutral conditions remain dominant through early spring 2026, with probabilities of 90% for March–May (MAM) and 65% for April–June (AMJ). However, the signal for El Niño strengthens rapidly during this period, with its probability rising from just 9% in MAM to 35% in AMJ indicating a clear shift toward warming. By May–July (MJJ), El Niño becomes the most likely outcome at 58%, overtaking ENSO-neutral (41%). From June–August (JJA) through October–December (OND), El Niño maintains the upper hand, with probabilities holding steady between 58% and 61%. Meanwhile, ENSO-neutral chances ease to 30–39%, and the likelihood of La Niña redevelopment remains minimal, at below 10%. Caution is advised when interpreting these longer-lead ENSO forecasts, as they extend through the boreal spring predictability barrier; accordingly, long-range outlooks should be viewed with appropriate uncertainty, even if they suggest a possible emerging outcome. A plot of the probabilities summarizes the forecast evolution. The climatological probabilities for La Niña, ENSO-neutral, and El Niño conditions vary seasonally, and are shown by the lines on the plot, and are given in a table at the bottom of this page for each 3-month season.
Caution is advised in interpreting the forecast distribution from the Gaussian standard error as the actual probabilities, due to differing biases and performance of the different models. In particular, this approach considers only the mean of the predictions, and not the total range across the models, nor the ensemble range within individual models. At longer leads, the skill of the models degrades, and uncertainty in skill must be convolved with the uncertainties from initial conditions and differing model physics, which leads to more climatological probabilities in the long-lead ENSO Outlook than might be suggested by the suite of models. Furthermore, the expected skill of one model versus another has not been established using uniform validation procedures, which may cause a difference in the true probability distribution.
It is worth noting that the Relative Oceanic Niño Index (RONI), which measures sea surface temperature anomalies in the eastern equatorial Pacific relative to the rest of the equatorial band, has consistently and increasingly exceeded the −0.5 La Niña threshold for the past several overlapping seasons. For Jul–Sep, Aug–Oct, Sep–Nov, and Oct-Dec 2025, the RONI was -0.63, -0.77, -0.87, and -0.92 °C respectively. The Pacific Decadal Oscillation (PDO) Index in November 2025 recorded a value of −1.01.
A caution regarding the model-based ENSO plume predictions (released mid-month) is that factors such as known specific model biases and recent changes in the tropical Pacific that the models may have missed, are not considered. This approach is purely objective. Those issues are taken into account in CPC’s official outlooks, which are issued early in the month, and which will include some human judgment in combination with the model guidance.