July Climate Briefing: Models Continue to Predict El Niño in Coming Months
Read our ENSO Essentials & Impacts pages for more about El Niño and La Niña.
Tony Barnston provides an overview of the briefing:
What’s New
Sea-surface temperature (SST) anomalies in the equatorial Pacific Ocean have continued to warm since last month’s briefing. Weekly SST anomalies in the area of the Pacific that helps define El Niño and La Niña events, called the Nino3.4 region (see first image below), are rising, averaging +0.35ºC over the last four weeks.
Subsurface waters continue to indicate that an El Niño could be imminent, however, the winds in most of the equatorial Pacific have not shifted to reinforce a developing El Niño. For an El Niño to emerge, the weakening or reversal of tradewinds would need to become more widespread.
Last month, IRI and the National Oceanic and Atmospheric Administration’s Climate Prediction Center issued an El Niño Watch that remains in effect. The watch indicates conditions could favor development of El Niño in the next six months.
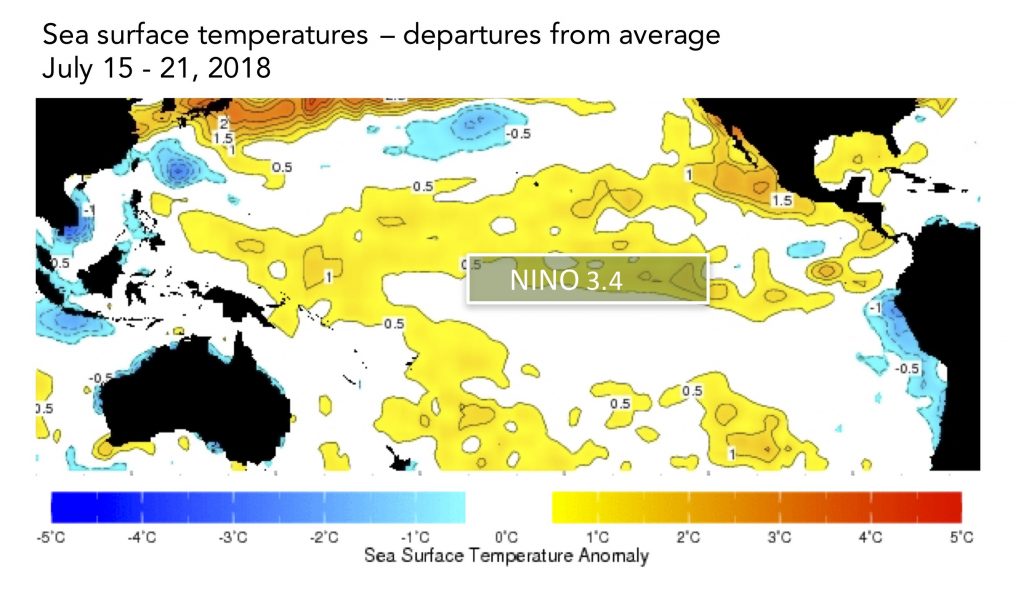
The sea-surface temperatures in the Nino3.4 region (approximated here) serve as a primary metric of El Niño and La Niña conditions. Data from the IRI Data Library. Image: IRI/Elisabeth Gawthrop
Even though the winds aren’t looking very #ElNiño-like, there’s still plenty of warm water below the surface. Need winds to kick in for El Niño to manifest. Do the models think this will happen? #IRIforecast pic.twitter.com/xmn0CJADR3
— IRI (@climatesociety) July 19, 2018
ENSO Forecasts
To predict ENSO conditions, computers model the SSTs in the Nino3.4 region over the next several months. The plume graph below shows the outputs of these models, some of which use equations based on our physical understanding of the system (called dynamical models), and some of which use statistics, based on the long record of historical observations. The current forecasts are the first to be released after what scientists call the spring predictability barrier – a time when it’s notoriously difficult for models to do a good job of forecasting upcoming conditions.
For the last two months, models’ predictions of the SST anomalies in Nino3.4 have been predicting a weak to moderate El Niño. The dynamical models call for warmer conditions in the coming months compared to the statistical models, but the statistical models reach a slightly warmer overall peak temperature in later seasons. The statistical models’ mean tops out at about +1ºC in the December 2018 – February 2019 season, while the mean of the dynamical model forecasts reaches its maximum of about +0.9ºC in the February – April 2019 season.
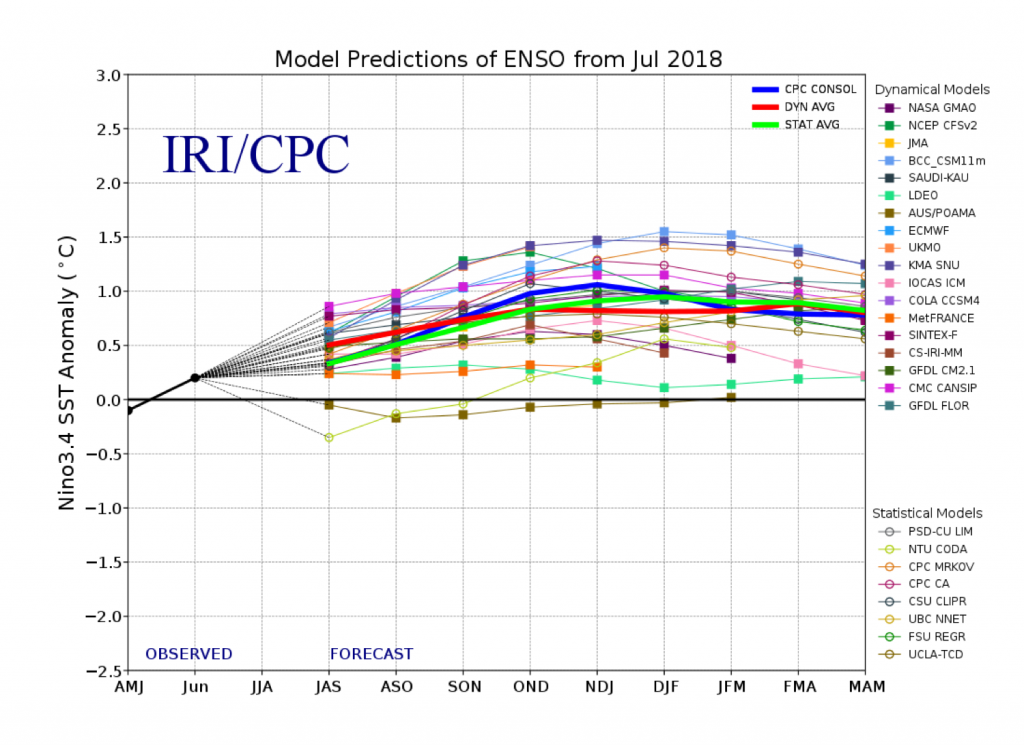
This graph shows forecasts made by dynamical and statistical models for SST in the Nino 3.4 region for nine overlapping 3-month periods. Note that the expected skills of the models, based on historical performance, are not equal to one another.
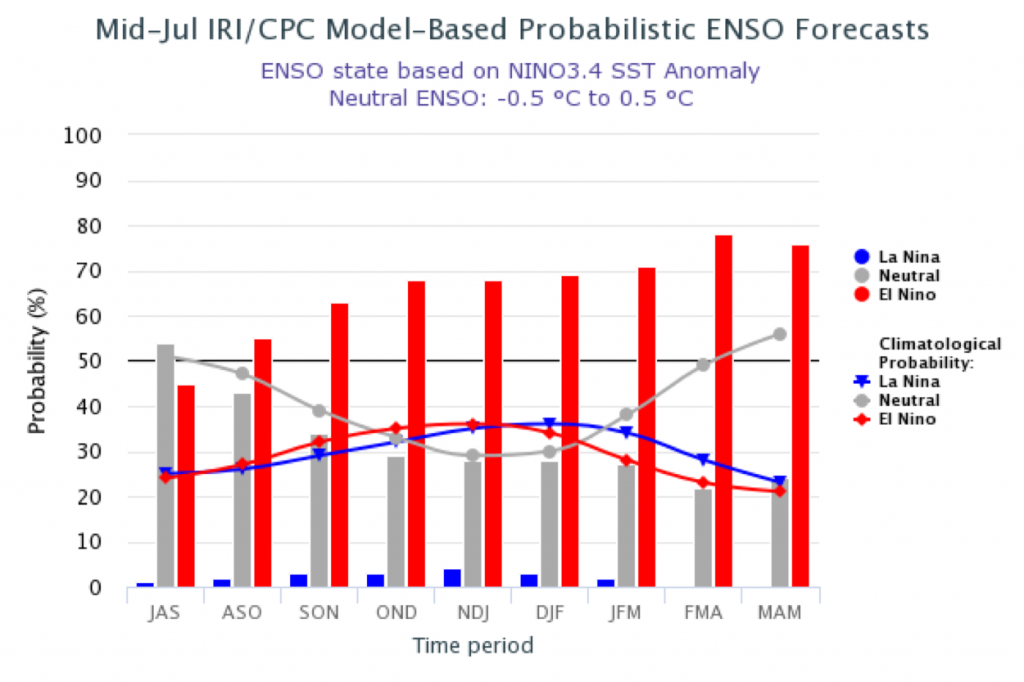
The IRI/CPC probabilistic ENSO forecast issued mid-July 2018. Note that bars indicate likelihood of El Niño occurring, not its potential strength. Unlike the official ENSO forecast issued at the beginning of each month, IRI and CPC issue this updated forecast based solely on model outputs. The official forecast, available at http://1.usa.gov/1j9gA8b, also incorporates human judgement.
Based on the model outputs, the odds that neutral ENSO conditions will persist are around 55% for the current July – September season. In the August – October season, El Niño edges out neutral as the most likely condition according to models. El Niño’s probability continues to increase through the end of the forecast period, reaching close to 80% in the February – April 2019 season.
ENSO in context: Resource page on climate variability
The chances for El Niño conditions in the official probabilistic forecast issued by CPC and IRI in early July are very similar to the mid-month CPC/IRI forecast. The early-July forecast uses human judgement in addition to model output, while the mid-month forecast relies solely on model output. More on the difference between these forecasts in this IRI Medium post.
IRI’s Global Seasonal Forecasts
Each month, IRI issues seasonal climate forecasts for the entire globe. These forecasts take into account the latest model outputs and indicate which areas are more likely to see above- or below-normal temperatures and precipitation.
Here are our latest global seasonal forecasts for precipitation. Some typical #ElNiño impacts showing up, reflecting the weak El Niño event that climate models are currently predicting. #IRIforecast pic.twitter.com/vnB08o3mgA
— IRI (@climatesociety) July 19, 2018
For the upcoming August – October season, odds are strongly tipped in favor of below-normal rainfall across much of Indonesia, Central America and the Caribbean. Eastern Australia, Taiwan, South Korea and parts of western Canada, western Alaska and coastal northern Brazil show moderate odds for below-normal rainfall. Areas with some chance of above-normal precipitation include southern Somalia, eastern Kenya and northern Algeria.
All forecast maps, including temperature in addition to precipitation, and including a description of the methodologies, are available on our seasonal forecast page. Additional forecast formats, such as our flexible forecast maproom, are available in the IRI Data Library.
Learn more about El Niño and La Niña on our ENSO resources page, and sign up here to get notified when the next forecast is issued. In the meantime, check out #IRIforecast.
You must be logged in to post a comment.