December Climate Briefing: New Year, Same La Niña
Read our ENSO Essentials & Impacts pages for more about El Niño and La Niña.
Tony Barnston provides an overview of the briefing
What’s New
Since last month’s briefing, sea-surface temperature (SST) anomalies in the area of the central equatorial Pacific Ocean that helps define El Niño and La Niña events, called the Nino3.4 region (see map below), have held at a similar average as the month before, around -0.8ºC. This number falls in the category of a weak La Niña state, although conditions will have to persist for several months for a La Niña to be officially documented in the historical record.
Because IRI and the National Oceanic and Atmospheric Administration’s Climate Prediction Center predict that these conditions will continue in the near-term, the ENSO alert level was upgraded last month from a La Niña Watch to a La Niña Advisory, where it remains.
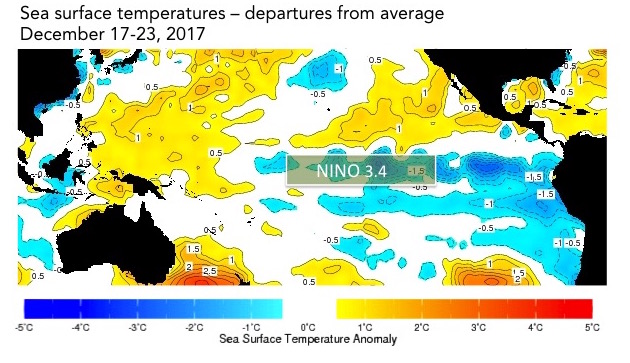
The sea-surface temperatures in the Nino3.4 region (approximated here) serve as a primary metric of El Niño and La Niña conditions. Data from the IRI Data Library. Image: IRI/Elisabeth Gawthrop
ENSO Forecasts
From the Earth Institute: How Will La Niña Affect Winter in the U.S.?
To predict ENSO conditions, computers model the SSTs in the Nino3.4 region over the next several months. The plume graph below shows the outputs of these models, some of which use equations based on our physical understanding of the system (called dynamical models), and some of which use statistics, based on the long record of historical observations.
The average of the SST anomalies predicted by the models in this month’s forecast are very close to the predictions in last month’s forecast. Both dynamical and statistical models indicate a gradual warming over the forecast period, with both crossing into neutral ENSO territory in the March-May season. The dynamical models warm at higher rate, with conditions by next summer approaching +0.5ºC anomalies. The statistical models top out right around the 0.0ºC anomaly mark. This period at the end of the forecast, however, is past the spring predictability barrier and is highly uncertain.


Based on the model outputs, La Niña conditions are the most likely ENSO outcome through early 2018, with the highest odds topping 80% for the December-February season that’s already underway. This month’s forecast has La Niña conditions persisting a little longer than last month’s forecast predicted, with neutral conditions not taking over as the most likely outcome until the March-May 2018 season.
ENSO in context: Resource page on climate variability
The official probabilistic forecast issued by CPC and IRI in early December indicates a similar overall outlook but with somewhat higher La Niña odds for the next few seasons, and equal odds of La Niña and neutral conditions for the March-May season. This early-December forecast uses human judgement in addition to model output, while the mid-month forecast relies solely on model output. More on the difference between these forecasts in this IRI Medium post.
IRI’s Global Seasonal Forecasts
Each month, IRI issues seasonal climate forecasts for the entire globe. These forecasts take into account the latest model outputs and indicate which areas are more likely to see above- or below-normal temperatures and precipitation.
Rainfall forecasts show some typical effects of #LaNina: above-avg precip. in Philippines & north. Indonesia. Not showing up, however, are typical above avg rains in southern Africa & typical below avg rains in Greater Horn – blame it on weak response of Indian Ocean dipole. pic.twitter.com/F0KgdO7i9W
— IRI (@climatesociety) December 21, 2017
For the upcoming January – March 2018 season, odds are moderately to strongly tipped in favor of above-normal rainfall in the Philippines and parts of Indonesia, as well as central-northern South America. Areas of northern Europe and Asia show some increased odds for above-normal precipitation, as well as parts of the interior U.S. and Alaska. The southern United States and central to northern Mexico show the strongest, most widespread probabilities for drier-than-normal conditions. Parts of South America, southern Africa, central and eastern Asia, as well as smaller, scattered areas around the world show some increased chance for drier-than-normal conditions.
All forecast maps, including temperature in addition to precipitation, are available on our seasonal forecast page.
As of April of this year, these seasonal forecasts use a new methodology. The IRI probabilistic seasonal climate forecast product is now based on a re-calibration of model output from the NOAA’s North American Multi-Model Ensemble Project (NMME). The output from each NMME model is re-calibrated prior to multi-model ensembling to form reliable probability forecasts. The forecasts are now presented on a 1-degree latitude-longitude grid. More on this change on the seasonal forecast page, as well as in this Q&A with three of our climate scientists.
Learn more about El Niño and La Niña on our ENSO resources page, and sign up here to get notified when the next forecast is issued. In the meantime, check out #IRIforecast.
You must be logged in to post a comment.