November Climate Briefing: La Niña Arrives, Some Impacts Likely
Read our ENSO Essentials & Impacts pages for more about El Niño.
Tony Barnston provides an overview of the briefing
Since last month’s briefing, sea-surface temperatures in the area of the central equatorial Pacific Ocean that define El Niño and La Niña events, called the Nino3.4 region, have remained cooler-than-average. Since July, weekly sea-surface temperature anomalies have been around or just below the -0.5ºC threshold used to define La Niña (see below images).
These sea-surface temperatures seem to indicate a borderline La Niña event, but the coupled nature of La Niña events means that both the ocean and atmosphere must be “participating.” Atmospheric signs of La Niña include stronger than normal trade winds in the equatorial Pacific and above-average convection activity (i.e. more thunderstorms than normal) along the equator in the western Pacific. Similarly, below-average convection activity along the equator in the region of the International Dateline (180º) is also indicative of La Niña conditions.
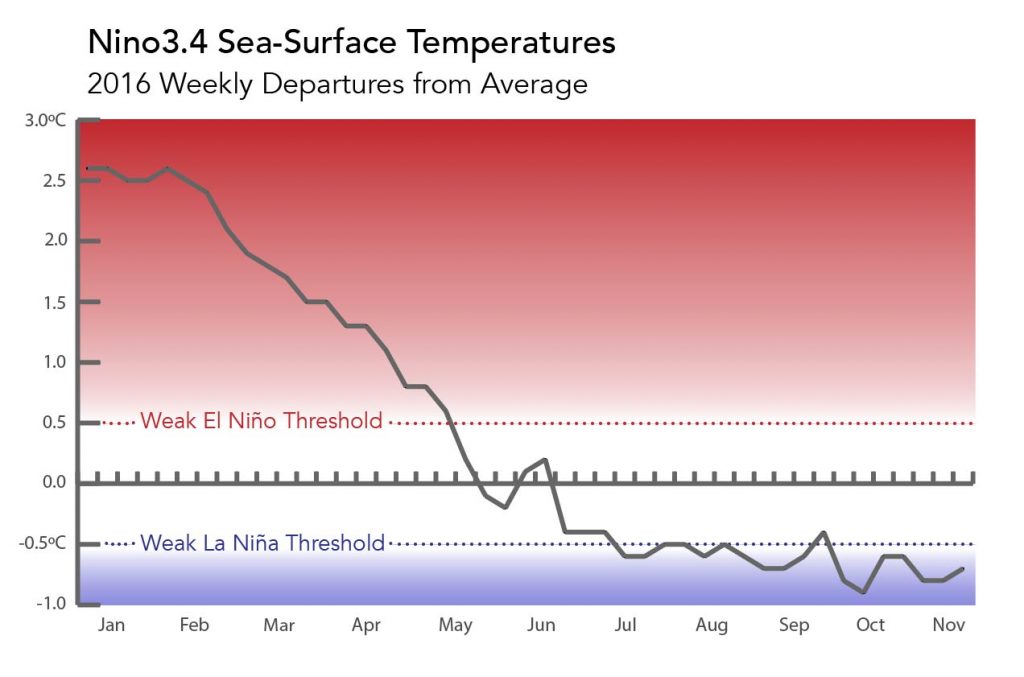
Weekly sea-surface temperature anomalies in the Nino3.4 region of the central equatorial Pacific Ocean. For reasons outlined in this NOAA blog post, comparison of SSTs between datasets should be cautious, largely due to variation in data collection methods and resolution of the datasets. The dataset used for this figure (called OISSTv2) is not the one used in NOAA’s records for official peak strength (called ERSSTv4), though OISSTv2 is the one used in initializing models.
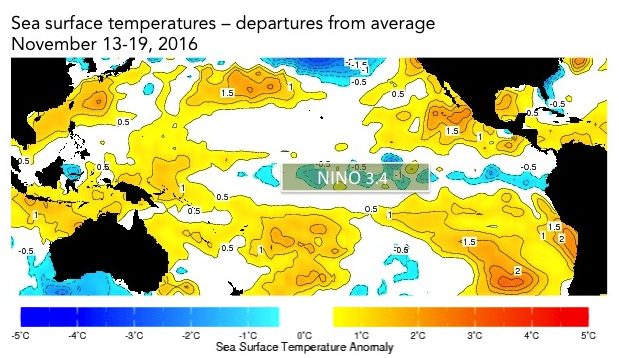
The sea-surface temperatures in the Nino3.4 region (approximated here) serve as a primary metric of El Niño and La Niña conditions. Data from the IRI Data Library. Image: IRI/Elisabeth Gawthrop
While the trade winds have only been near-average or slightly stronger than average, the convection anomalies are more along the lines of what is typical for La Niña (see figure in video). It is these convection anomalies that scientists say lead to the cascading climate impacts around the world. Because of these persistent convection anomalies and because Nino3.4 sea-surface temperature anomalies have consistently been just below -0.5ºC, the National Oceanic and Atmospheric Administration’s Climate Prediction Center issued a La Niña advisory this month.
As we have been reporting since September, some La Niña-like impacts are expected to occur regardless of whether a La Niña is officially declared; the -0.5ºC threshold is a guideline for impacts, but not an absolute.


To predict El Niño, computers model the SSTs in the Nino3.4 region over the next several months. The graph in the first image of the gallery just above shows the outputs of these models, some of which use equations based on our physical understanding of the system (called dynamical models), and some of which use statistics, based on the long record of historical observations.
The mean of the statistical models calls for SST conditions to gradually warm. Similar to last month’s forecast, these models call for SST anomalies to reach 0ºC in the March-April-May season. The mean of the dynamical models runs in parallel to the statistical models but a couple tenths of a degree cooler through the March-April-May season.
La Niña in context: Resource page on climate variability
Based on these model outputs, odds for La Niña quickly decline after the December-January-February season, with neutral conditions dominating in the new year (see second graph in gallery above). By the Northern Hemisphere summer, chances for each ENSO phase are close to average.
The official probabilistic forecast issued by CPC and IRI in early November shows similar odds for ENSO conditions. This early-November forecast uses human judgement in addition to model output, while the mid-November forecast relies solely on model output.
Effects of La Niña on global seasonal forecasts
Each month, IRI issues seasonal climate forecasts for the entire globe. These forecasts take into account the latest sea-surface temperature projections and indicate which areas are more likely to see above- or below-normal temperatures and rainfall.


For the upcoming December-February period, the forecast shows a moderate to strong likelihood of drier-than-normal conditions over the southern United States and northern Caribbean, with the highest odds of such conditions over Florida (first image in gallery above, click to enlarge). There are also slightly enhanced odds of drier-than-normal conditions in southeast South America, southeast Europe and the southern coast of Alaska.
The November-January forecast also shows a strong chance of above-average precipitation in some areas of Indonesia and the Philippines. Other regions with an elevated chance of above-average precipitation include northern South America, western Australia, southern Africa and portions of the northern United States.
The impacts listed above are specifically for the December-February season. For later seasons, see forecast maps in the image gallery and on our seasonal forecast page.
Learn more about La Niña on our ENSO resources page, and sign up here to get notified when the next forecast is issued. In the meantime, check out #IRIforecast or use #ENSOQandA on Twitter to ask your La Niña questions.
You must be logged in to post a comment.