California Drought: Happy New Year?
Using the IRI Data Library to Predict and Track the 2016 Water Year
This post is an excerpt from a story published by IRI on Medium.com, where we are updating the post each month with the latest forecasts. View the full story and forecast maps here.
October 1st marks the first day of the new “Water Year” for California, which is like the state’s fiscal year for water management. Most of the rain during the water year falls in the first half. Water stored in those six months is used during the second half, when much less rain falls. California is in the midst of what scientists say is the driest spell in 500 years. The 2015 water year, which just ended, was the fourth consecutive dry year, with 2014 being the 3rd-driest year since records began 120 years ago. Moreover, the 2015 water year was the warmest on record in California, beating the previous record in 1995–96 by almost a degree and drying out soil and increasing evaporation of the water that did make it to reservoirs.
…
So, what does the current forecast reveal about California’s wet season? While there are many ways to statistically skin the climate cat, we’re going to use the IRI Data Library to show average and forecasted seasonal precipitation over California as the water year progresses. We’ll also show the seasonal observations from the last two years, for comparison. And, we’ll update with this year’s observed precipitation, as those numbers come in.
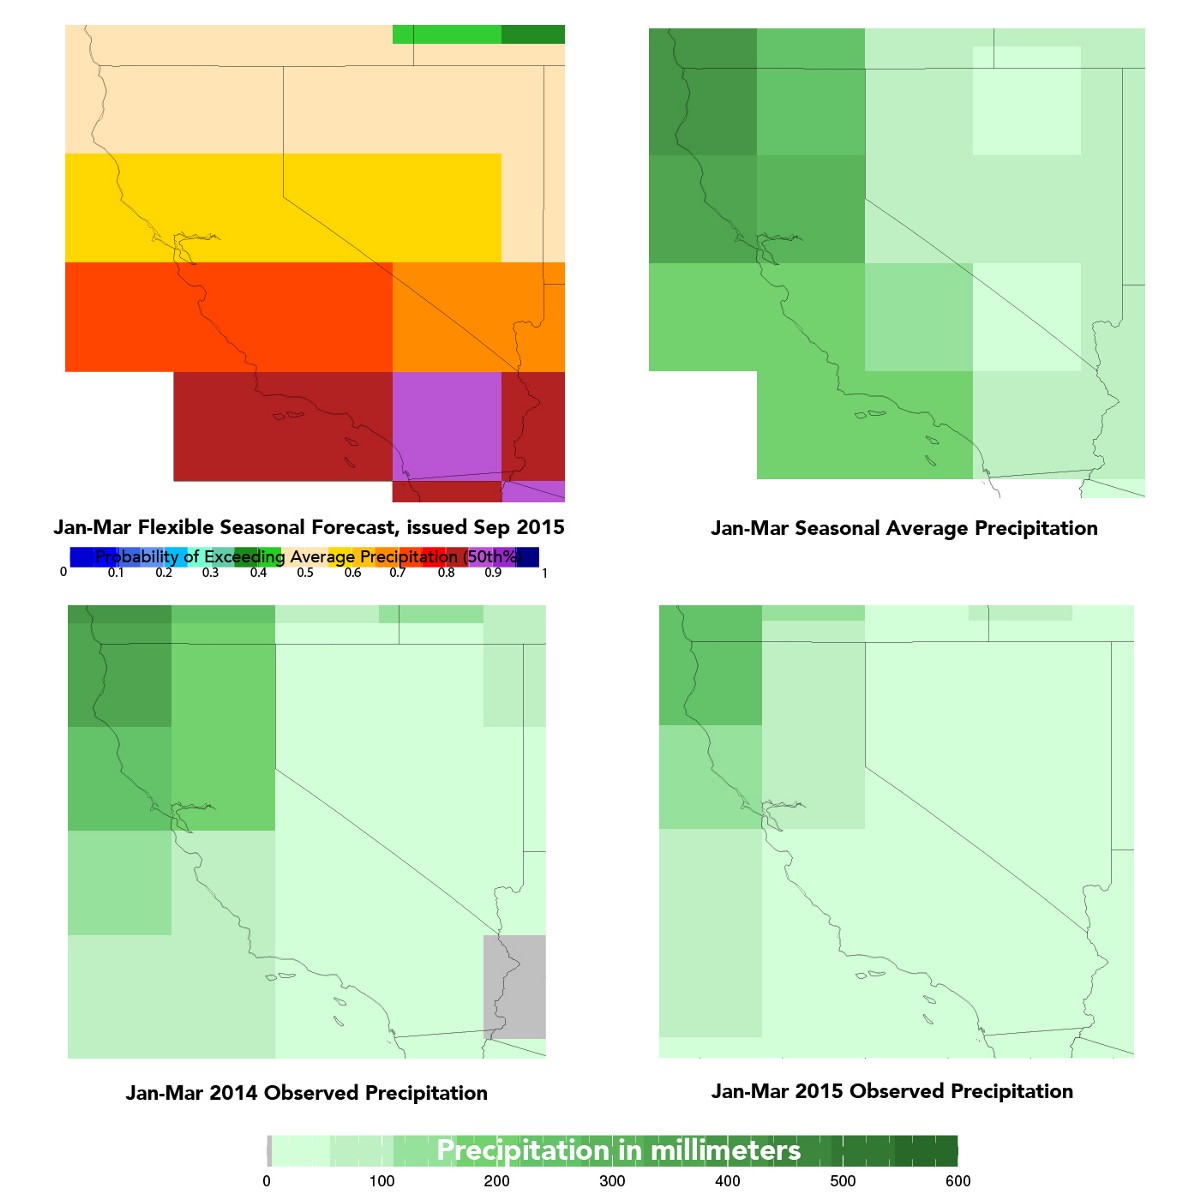
The top left image shows the forecast for the season (in this case, Jan-Mar 2016) relative to the season’s average. Much of the state has at least a 60% chance of getting more precipitation than average, with the southern quarter of the state having at least an 80% chance. The top right image shows the average precipitation (rain and snow) for the January to March season based on 1981–2010 data. The numbers overall are higher than those from October to December, but you can still see the trend of more precipitation in the northern part of the state. These are some of the most critical months for California to receive precipitation that can be used in the rest of the year. The two bottom images show the precipitation from the last two January to March seasons. 2015 was drier than 2014, but both were below average, as indicated by lighter shades than those seen in the map of average precipitation.
You must be logged in to post a comment.