ENSO Forecast Navigation

ENSO Forecasts

ENSO Forecast

2014 July Quick Look

Published: July 17, 2014

A monthly summary of the status of El Niño, La Niña, and the Southern Oscillation, or ENSO, based on the NINO3.4 index (120-170W, 5S-5N)

During June through early-July the observed ENSO conditions remained near the borderline of a weak El Niño condition in the ocean, but the atmosphere so far has shown little involvement. Most of the ENSO prediction models indicate more warming coming in the months ahead, leading to sustained El Niño conditions by the middle or late portion of northern summer.

Figures 1 and 3 (the official CPC ENSO probability forecast and the objective model-based IRI ENSO probability forecast, respectively) are often quite similar. However, occasionally they may differ noticeably. There can be several reasons for differences. One possible reason is that the human forecasters, using their experience and judgment, may disagree to some degree with the models, which may have known biases. Another reason is related to the fact that the models are not run at the same time that the forecasters make their assessment, so that the starting ENSO conditions may be slightly different between the two times. The charts on this Quick Look page are updated at two different times of the month, so that between the second and the third Thursday of the month, the official forecast (Fig. 1) has just been updated, while the model-based forecasts (Figs. 3 and 4) are still from the third Thursday of the previous month. On the other hand, from the third Thursday of the month until the second Thursday of the next month, the model-based forecasts are more recently updated, while the official forecasts remain from the second Thursday of the current month.
Click on the for more information on each figure.

Historically Speaking

    El Niño and La Niña events tend to develop during the period Apr-Jun and they
  • Tend to reach their maximum strength during October - February
  • Typically persist for 9-12 months, though occasionally persisting for up to 2 years
  • Typically recur every 2 to 7 years

ENSO Forecast

CPC ENSO Update

Published: July 10, 2014

El Niño/Southern Oscillation (ENSO) Diagnostic Discussion issued by the Climate Prediction Center/NCEP/NWS

ENSO Alert System Status: El Niño Watch

Synopsis: The chance of El Niño is about 70% during the Northern Hemisphere summer and is close to 80% during the fall and early winter

During June 2014, above-average sea surface temperatures (SST) were most prominent in the eastern equatorial Pacific, with weakening evident near the International Date Line (Figure 1). This weakening was reflected in a decrease to +0.3°C in the Niño-4 index (Figure 2). The Niño-3.4 index remained around +0.5°C throughout the month, while the easternmost Niño-3 and Niño-1+2 indices are +1.0°C or greater. Subsurface heat content anomalies (averaged between 180º-100ºW) have decreased substantially since late March 2014 and are now near average (Figure 3). However, above-average subsurface temperatures remain prevalent near the surface (down to 100m depth) in the eastern half of the Pacific. The upper-level and low-level winds over the tropical Pacific remained near average, except for low-level westerly anomalies over the eastern Pacific. Convection was enhanced near and just west of the Date Line and over portions of Indonesia (Figure 5). Still, the lack of a clear and consistent atmospheric response to the positive SSTs indicates ENSO-neutral.

Over the last month, no significant change was evident in the model forecasts of ENSO, with the majority of models indicating El Niño onset within June-August and continuing into early 2015 (Figure 6). The chance of a strong El Niño is not favored in any of the ensemble averages for Niño-3.4. At this time, the forecasters anticipate El Niño will peak at weak-to-moderate strength during the late fall and early winter (3-month values of the Niño-3.4 index between 0.5°C and 1.4°C). The chance of El Niño is about 70% during the Northern Hemisphere summer and is close to 80% during the fall and early winter (click CPC/IRI consensus forecast for the chance of each outcome).

This discussion is a consolidated effort of the National Oceanic and Atmospheric Administration (NOAA), NOAA’s National Weather Service, and their funded institutions. Oceanic and atmospheric conditions are updated weekly on the Climate Prediction Center web site (El Niño/La Niña Current Conditions and Expert Discussions). Forecasts are also updated monthly in the Forecast Forum section of CPC’s Climate Diagnostics Bulletin. Additional perspectives and analysis are also available in an ENSO blog.  

The next ENSO Diagnostics Discussion is scheduled for 7 August 2014. To receive an e-mail notification when the monthly ENSO Diagnostic Discussions are released, please send an e-mail message to: ncep.list.enso-update@noaa.gov.


CPC/IRI Early-Month Consensus ENSO Forecast Probabilities

Season La Niña Neutral El Niño
JJA 2014 1% 35% 64%
JAS 2014 1% 31% 68%
ASO 2014 1% 27% 72%
SON 2014 1% 23% 76%
OND 2014 1% 21% 78%
NDJ 2014 2% 20% 78%
DJF 2014 3% 22% 75%
JFM 2015 3% 25% 72%
FMA 2015 3% 28% 69%

IRI ENSO Forecast

IRI Technical ENSO Update

Published: July 17, 2014

Recent and Current Conditions

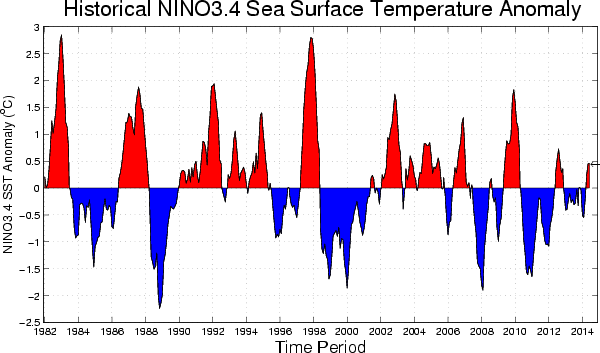
The SST anomaly in the Nino3.4 region in recent weeks has been near the borderline of neutral and El Nino during the mid-June to mid-July period, 2014. For June the Nino3.4 SST anomaly was 0.46 C, indicative of neutral conditions but very close to the borderline of El Nino, and for April-June it was 0.39 C. The IRI’s definition of El Niño, like NOAA/Climate Prediction Center’s, requires that the SST anomaly in the Nino3.4 region (5S-5N; 170W-120W) exceed 0.5 C. Similarly, for La Niña, the anomaly must be -0.5 C or less. The climatological probabilities for La Niña, neutral, and El Niño conditions vary seasonally, and are shown in a table at the bottom of this page for each 3-month season. The most recent weekly SST anomaly in the Nino3.4 region was 0.3 C, which is slightly below the 0.46 C observed in June, not far from the borderline of an El Niño condition. The trend is a very slow upward one for Apr-Jun to Jun. However, although the SST has been near or slightly below the borderline of weak El Niño conditions, the atmospheric participation in an El Niño-like pattern has been absent or weak.

Expected Conditions

What is the outlook for the ENSO status going forward? The most recent official diagnosis and outlook was issued earlier this month in the NOAA/Climate Prediction Center ENSO Diagnostic Discussion, produced jointly by CPC and IRI; it called for a likelihood for a transition from neutral ENSO conditions to El Niño conditions during the summer 2014 currently in progress, with probabilities of El Niño rising to 68% for Jul-Sep 2014, and to nearly 80% by northern autumn 2014. The latest set of model ENSO predictions, from mid-July, now available in the IRI/CPC ENSO prediction plume, is discussed below. Currently, Nino3.4 SST anomalies are slightly below the borderline of neutral and weak El Niño, and have been close to the borderline for nearly 2 months. Positive anomalies maximize in the far eastern part of the Pacific basin, with relatively weaker anomalies in the vicinity of the Nino3.4 region. Positive anomalies near the dateline have decreased from one month ago. Subsurface temperature anomalies across the eastern equatorial Pacific are at above average levels, but decreasing due to discharging into the atmosphere with positive SST anomalies in the far eastern part of the basin.  The integrated heat content has been slowly declining over the last couple of months and is now only at average levels. In the atmosphere, the basin-wide sea level pressure pattern (e.g. the SOI) has been fairly close to average over the last few months, but slightly negative recently. The low-level zonal winds and the upper level winds have also been close to average in recent weeks. Anomalous convection (as measured by OLR) has been positive somewhat to the west of the dateline, but near average near and east of the dateline.  These atmospheric conditions are not suggestive of El Niño despite the SST being near the borderline of El Niño. Together, the oceanic and atmospheric features continue to reflect neutral ENSO conditions that lean toward the borderline of weak El Niño. The ocean-atmosphere coupling needs to occur as the onset of El Niño conditions likely gets underway over the course of the remainder of northern summer and early fall seasons.

As of mid-July, none of the dynamical or statistical models models predicts La Niña SST conditions for the initial Jul-Sep 2014 season, 56% predicts El Niño conditions, and 44% indicates neutral ENSO. At lead times of 3 or more months into the future, statistical and dynamical models that incorporate information about the ocean’s observed subsurface thermal structure generally exhibit higher predictive skill than those that do not. For the Oct-Dec 2014 season, among models that do use subsurface temperature information, 25% predicts ENSO-neutral SSTs, 75% predicts El Niño conditions and none predicts La Niña conditions. For all model types, the probability for neutral ENSO conditions is below 30% between Oct-Dec 2014 and Dec-Feb 2014/15. Probabilities for El Niño rise to more than 75% between these same two seasons. Probabilities for El Niño fall to about 60% by Mar-May 2015.  No model predicts La Niña conditions for any of the 3-month periods between Jul-Sep 2014 and Mar-May 2015.

Note  – Only models that produce a new ENSO prediction every month are included in the above statement.

Caution is advised in interpreting the distribution of model predictions as the actual probabilities. At longer leads, the skill of the models degrades, and skill uncertainty must be convolved with the uncertainties from initial conditions and differing model physics, leading to more climatological probabilities in the long-lead ENSO Outlook than might be suggested by the suite of models. Furthermore, the expected skill of one model versus another has not been established using uniform validation procedures, which may cause a difference in the true probability distribution from that taken verbatim from the raw model predictions.

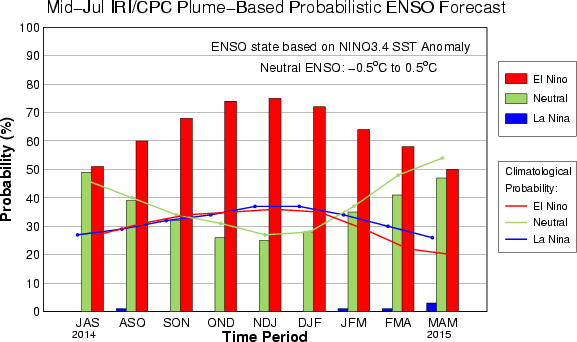
An alternative way to assess the probabilities of the three possible ENSO conditions is more quantitatively precise and less vulnerable to sampling errors than the categorical tallying method used above. This alternative method uses the mean of the predictions of all models on the plume, equally weighted, and constructs a standard error function centered on that mean. The standard error is Gaussian in shape, and has its width determined by an estimate of overall expected model skill for the season of the year and the lead time. Higher skill results in a relatively narrower error distribution, while low skill results in an error distribution with width approaching that of the historical observed distribution. This method shows probabilities for La Niña no higher than 1% for any period between Jul-Sep 2014 through Feb-Apr 2015, rising to 3% for Mar-May 2015.  Model probabilities for neutral ENSO conditions are 49% for the initial period of Jul-Sep 2014, 39% for the next running period of Aug-Oct, and the hover between 25% and 32% through the northern fall 2014 and into winter 2014-15, rising again to 41% for Feb-Apr 2015 and to 47% for Mar-May 2015. Probabilities for El Niño are 51% for Jul-Sep 2014, rise to near 60% for Aug-Oct, 68% for Sep-Nov, and to 75% for Nov-Jan 2014-15. The models collectively favor El Niño over other ENSO conditions by a clear margin between Aug-Oct 2014 and Jan-Mar 2015.   A plot of the probabilities generated from this most recent IRI/CPC ENSO prediction plume using the multi-model mean and the Gaussian standard error method summarizes the model consensus out to about 10 months into the future. The same cautions mentioned above for the distributional count of model predictions apply to this Gaussian standard error method of inferring probabilities, due to differing model biases and skills. In particular, this approach considers only the mean of the predictions, and not the total range across the models, nor the ensemble range within individual models.

The probabilities derived from the models on the IRI/CPC plume describe, on average, a likely development of El Niño development during Jul-Sept 2014, and even more likely by Aug-Oct, as the objective model-based probabilities for El Niño exceed those for neutral ENSO by more than a small margin between Aug-Oct and Jan-Mar 2015. The consensus of model predictions calls for a weak El Niño event, a moderate event being second most likely, no El Nino being next most likely, and a strong event being least likely. A caution regarding this latest set of model-based ENSO plume predictions, is that factors such as known specific model biases and recent changes that the models may have missed will be taken into account in the next official outlook to be generated and issued in early October by CPC and IRI, which will include some human judgement in combination with the model guidance.


Climatological Probabilities
Season La Niña Neutral El Niño
DJF 37% 28% 35%
JFM 34% 37% 29%
FMA 30% 48% 22%
MAM 26% 54% 20%
AMJ 24% 54% 22%
MJJ 25% 51% 24%
JJA 25% 50% 25%
JAS 27% 46% 27%
ASO 29% 40% 31%
SON 32% 34% 34%
OND 34% 31% 35%
NDJ 37% 27% 36%


IRI ENSO Forecast Histogram Image

IRI/CPC Mid-Month Plume-Based ENSO Forecast Probabilities

Season La Niña Neutral El Niño
JAS 2014 ~0% 49% 51%
ASO 2014 1% 39% 60%
SON 2014 ~0% 32% 68%
OND 2014 ~0% 26% 74%
NDJ 2014 ~0% 25% 75%
DJF 2014 ~0% 28% 72%
JFM 2015 1% 35% 64%
FMA 2015 1% 41% 58%
MAM 2015 3% 47% 50%

ENSO Forecast

IRI Model-Based Probabilistic ENSO Forecast

Published: July 17, 2014

A purely objective ENSO probability forecast, based on regression, using as input the model predictions from the plume of dynamical and statistical forecasts shown in the ENSO Predictions Plume. Each of the forecasts is weighted equally. It is updated near or just after the middle of the month, using forecasts from the plume models that are run in the first half of the month. It does not use any human interpretation or judgment. This is updated on the third Thursday of the month.


IRI ENSO Forecast Histogram Image


IRI/CPC Mid-Month Plume-Based ENSO Forecast Probabilities

Season La Niña Neutral El Niño
JAS 2014 ~0% 49% 51%
ASO 2014 1% 39% 60%
SON 2014 ~0% 32% 68%
OND 2014 ~0% 26% 74%
NDJ 2014 ~0% 25% 75%
DJF 2014 ~0% 28% 72%
JFM 2015 1% 35% 64%
FMA 2015 1% 41% 58%
MAM 2015 3% 47% 50%

ENSO Forecast

CPC Official Probabilistic ENSO Forecast

Published: July 10, 2014

The official CPC ENSO probability forecast, based on a consensus of CPC and IRI forecasters. It is updated during the first half of the month, in association with the official CPC ENSO Diagnostic Discussion. It is based on observational and predictive information from early in the month and from the previous month. It uses human judgment in addition to model output, while the forecast shown in the Model-Based Probabilistic ENSO Forecast relies solely on model output. This is updated on the second Thursday of every month.


NOAA?CPC ENSO Forecast Image
NOAA/CPC ENSO Forecast Graphic, courtesy of NOAA/CPC

CPC/IRI Early-Month Consensus ENSO Forecast Probabilities

Season La Niña Neutral El Niño
JJA 2014 1% 35% 64%
JAS 2014 1% 31% 68%
ASO 2014 1% 27% 72%
SON 2014 1% 23% 76%
OND 2014 1% 21% 78%
NDJ 2014 2% 20% 78%
DJF 2014 3% 22% 75%
JFM 2015 3% 25% 72%
FMA 2015 3% 28% 69%

ENSO Forecast

IRI ENSO Predictions Plume

Published: July 17, 2014

Note on interpreting model forecasts

The following graph and table show forecasts made by dynamical and statistical models for SST in the Nino 3.4 region for nine overlapping 3-month periods. Note that the expected skills of the models, based on historical performance, are not equal to one another. The skills also generally decrease as the lead time increases. Thirdly, forecasts made at some times of the year generally have higher skill than forecasts made at other times of the year--namely, they are better when made between June and December than when they are made between February and May. Differences among the forecasts of the models reflect both differences in model design, and actual uncertainty in the forecast of the possible future SST scenario.

Interactive Chart

You can highlight a specific model by hovering over it either on the chart or the legend. Selecting An item on the legend will toggle the visibility of the model on the page. You can also select DYN MODELS or STAT MODELS to toggle them all at once. Clicking on the "burger" menu above the legend will give you options to download the image or expand to full screen. If you have any feedback on this new feature, please let us know at webmaster@iri.columbia.edu.


List of Models Used


Forecast SST Anomalies (deg C) in the Nino 3.4 Region

Seasons (2014-2015)
Model JAS ASO SON OND NDJ DJF JFM FMA MAM
Dynamical models
NCEP CFS version 2 0.5 0.7 1 1.1 1 0.9 0.8 0.8
NASA GMAO model 0.7 0.9 1 1.1 1.2 1.2 1.1
Japan Met. Agency model 0.2 0.3 0.5 0.6 0.7
Scripps Inst. HCM 0.9 1 1.2 1.3 1.3 1.3 1.3 1.1 0.9
Lamont-Doherty model 0.5 0.4 0.3 0.3 0.3 0.3 0.4 0.4 0.6
POAMA (Austr) model -0.2 -0.1 0 0.1 0.1 0.1 0.2
ECMWF model 0.5 0.8 1.1 1.2 1.4
UKMO model 0.3 0.4 0.4 0.4
KMA (Korea) SNU model 0.8 1.1 1.2 1.2 1.1 1.1 1.1 1 0.9
ESSIC Intermed. Coupled model 0.4 0.3 0.4 0.4 0.4 0.4 0.3 0.2 0
COLA CCSM3 model 0.8 0.8 0.9 1 1 1 1 0.8 0.5
MÉTÉO FRANCE model 0.7 0.9 0.9 0.8 0.8
CSIR-IRI 3-model MME 0.7 0.9 1 1.2 1.3 1.4
GFDL CM2.1 Coupled Climate model 0.5 0.6 0.6 0.6 0.5 0.6 0.6 0.7 0.7
Canadian Coupled Fcst Sys 0.9 1 1 1 1 1 0.8 0.7 0.6
GFDL CM2.5 FLOR Coupled Climate model 0.7 0.8 0.9 1 1 1.1 1.1 1.1 1
Average, dynamical models 0.5 0.7 0.8 0.8 0.9 0.9 0.8 0.8 0.6
Statistical models
NCEP/CPC Markov model 0.3 0.4 0.5 0.6 0.6 0.7 0.7 0.6 0.5
NOAA/CDC Linear Inverse 0.2 0.1 0 -0.1 -0.1 -0.1 -0.1 -0.1 -0.1
NCEP/CPC Constructed Analog 0.6 0.6 0.8 1.1 1.2 1.1 1 0.7 0.6
NCEP/CPC Can Cor Anal 0.4 0.4 0.5 0.6 0.6 0.5 0.4 0.3 0.3
Landsea/Knaff CLIPER 0.2 0.7 1.1 1.6 1.6 1.5 1.4 1.3 1.2
Univ. BC Neural Network 0.6 0.7 0.7 0.8 0.8 0.7 0.7 0.7 0.6
FSU Regression 0.6 0.7 0.8 1 1.1 1 0.8 0.6 0.5
TCD – UCLA 0.9 1 1.1 1.2 1.1 0.8 0.6 0.4 0.2
UNB/CWC Nonlinear PCA 0.3 0.1 -0.1 -0.3 -0.4 -0.5 -0.5 -0.5 -0.5
Average, statistical models 0.4 0.5 0.6 0.7 0.7 0.6 0.5 0.5 0.4
Average, all models 0.5 0.6 0.7 0.8 0.8 0.8 0.7 0.6 0.5

Discussion of Current Forecasts

Most of the set of dynamical and statistical model predictions issued during late June and early July 2014 predict a transition from borderline El Nino conditions to weak El Nino conditions during northern mid-summer 2014 into late summer, with a steady warming predicted into fall 2014. Development of El Nino conditions appears approximately 50% likely for the Jul-Sep season of 2014, and rises to near 75% by Oct-Dec. In the most recent week, the SST anomaly in the Nino3.4 region was 0.3C, reflecting slightly less than borderline neutral/El Nino conditions. The weekly SSTs have hovered close to 0.5 for much of the last two months. Based on the multi-model mean predictions, and the expected skill of the models by start time and lead time, the probabilities (X100) for La Nina, neutral and El Nino conditions (using -0.5C and 0.5C thresholds) over the coming 9 seasons are:

IRI/CPC Mid-Month Plume-Based ENSO Forecast Probabilities

Season La Niña Neutral El Niño
JAS 2014 ~0% 49% 51%
ASO 2014 1% 39% 60%
SON 2014 ~0% 32% 68%
OND 2014 ~0% 26% 74%
NDJ 2014 ~0% 25% 75%
DJF 2014 ~0% 28% 72%
JFM 2015 1% 35% 64%
FMA 2015 1% 41% 58%
MAM 2015 3% 47% 50%

Summary of forecasts issued over last 22 months

The following interactive plot shows the model forecasts issued not only from the current month (as in the plot above), but also from the 21 months previous to this month. The observations are shown up to the most recently completed 3-month period. The plots allow comparison of plumes from the previous start times, or examination of the forecast behavior of a given model over time.
Hovering over any single model will highlight that particular model in the chart.
Clicking a particular model will hide/show that model in the chart.
At the bottom of the plot, you can select which models to show in the chart: all the models, the dynamical models only, or the statistical models only.


Notes on the data 

Only models producing forecasts on a monthly basis are included. This means that some models whose forecasts appear in the Experimental Long-Lead Forecast Bulletin (produced by COLA) do not appear in the table.

Once an IRI ENSO probability forecast has been published, the results stand even if a model reports an error and changes their data. When this happens we will update the plume with the model's correct values even though our forecast hasn't changed. What this means is that our forecast is always the same, but the underlying data may be different from what we based our forecast on.

The SST anomaly forecasts are for the 3-month periods shown, and are for the Nino 3.4 region (120-170W, 5N-5S). Often, the anomalies are provided directly in a graph or a table by the respective forecasting centers for the Nino 3.4 region. In some cases, however, they are given for 1-month periods, for 3-month periods that skip some of the periods in the above table, and/or only for a region (or regions) other than Nino 3.4. In these cases, the following means are used to obtain the needed anomalies for the table:

  • Temporal averaging
  • Linear temporal interpolation
  • Visual averaging of values on a contoured map

The anomalies shown are those with respect to the base period used to define the normals, which vary among the groups producing model forecasts. They have not been adjusted to anomalies with respect to a common base period. Discrepancies among the climatological SST resulting from differing base periods may be as high as a quarter of a degree C in the worst cases. Forecasters are encouraged to use the standard 1991-2020 period as the base period, or a period not very different from it.

Historical SST Anomalies Image

The CPC ENSO forecast is released at 9am (Eastern Time) on the second Thursday of each month.

The IRI ENSO forecast is released on the 19th of each month. If the 19th falls on a weekend or holiday, it is released on the closest business day.

All data from this website is covered under the Creative Commons Attribution 4.0 License. When citing IRI ENSO images or data, please use "Images [or Data] provided by The International Research Institute for Climate and Society, Columbia University Climate School", with a link to https://iri.columbia.edu/ENSO.