July Climate Briefing: Nothin’ but Niño
Read our ENSO Essentials and ENSO Impacts pages to learn more about El Niño + check out the Storified summary of the #IRIforecast discussion on Twitter.
Tony Barnston provides an overview of the briefing
Changes from last month’s briefing
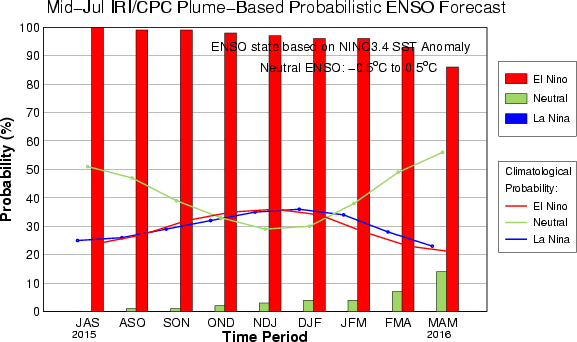
The IRI/CPC probabilistic ENSO forecast issued mid-July 2015. Note that bars indicate likelihood of El Niño occurring, not its potential strength. Unlike the official ENSO forecast issued at the beginning of each month, IRI and CPC issue this updated forecast based solely on model outputs. The official forecast, available at http://1.usa.gov/1j9gA8b, also incorporates human judgement.
Scientists usually cringe at the word certain, but the forecast for El Niño to continue through the July-September season is as close as it gets. There is a 99% chance of El Niño continuing through most of the fall, and chances stay at or above 95% through the end of the year. While the probability calculations are based only on the chance of at least weak El Niño conditions persisting, models are also showing a stronger event compared to last month’s model runs. The El Niño advisory issued in March by the National Oceanic and Atmospheric Administration’s Climate Prediction Center and IRI is still in effect.
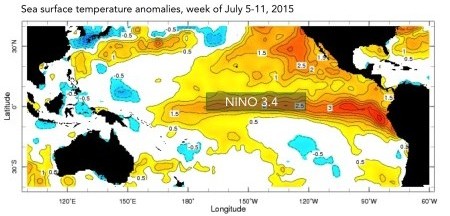
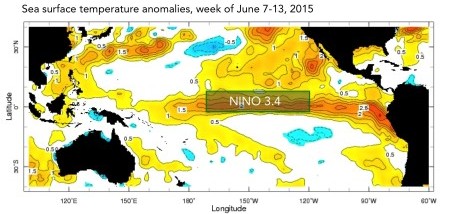
The sea-surface temperature (SST) anomaly in the Nino3.4 region was +1.5ºC last week, which is right at the threshold between moderate and strong El Niño conditions. This is up from last month, and the cooler-than-average western Pacific SSTs characteristic of El Niño have also developed since last month (see images). In order for a “strong” El Niño event to be officially declared, the Nino3.4 SSTs average will have to reach or exceed 1.5ºC for a full month.
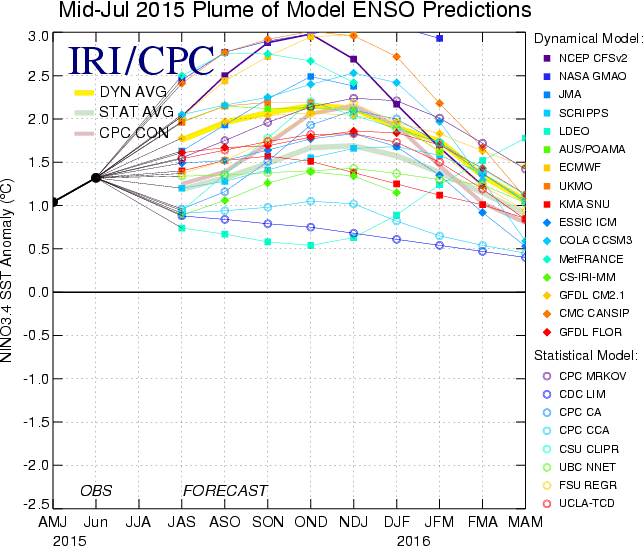
The following graph shows forecasts made by dynamical and statistical models for SST in the Nino 3.4 region for nine overlapping 3-month periods. Note that the expected skills of the models, based on historical performance, are not equal to one another.
To predict El Niño, computers model the SSTs in this region over the next several months. The plume below shows the outputs of these models, some of which use our physical understanding of the system (called dynamical models), and some of which used statistics, based on the long record of historical observations.
The mean of both statistical and dynamic models call for an event peaking above the +1.5ºC “strong” El Niño threshold. The average of the dynamical models is stronger, with a peak strength reaching above the +2.0ºC mark. The variation among the model outputs is significant, however, with a spread of about 3ºC.
Effects of El Niño on global seasonal forecasts
Each month, IRI issues seasonal climate forecasts for the entire globe. These forecasts take into account the latest ENSO SST projections and indicate which areas are more likely to see above or below normal temperatures and rainfall.
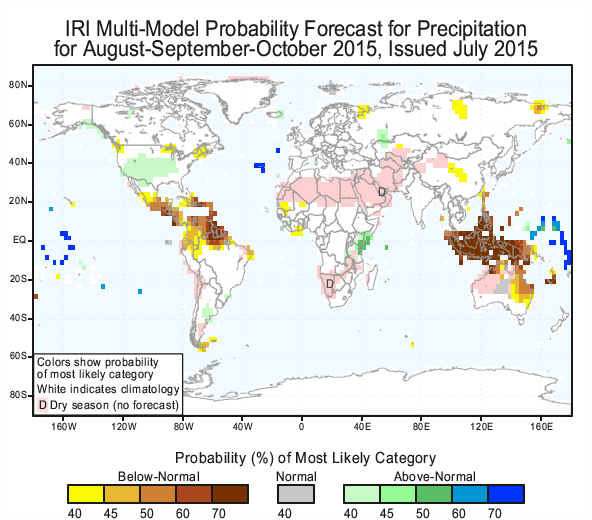
For the August-October period, the forecast continues to show a strong likelihood of drier-than-normal conditions over Indonesia, northern South America and parts of Central America and the Caribbean (image right). There are also increased odds for drier-than-normal conditions in parts of western Africa, central China and eastern Australia. Wetter-than-average conditions are predicted to be more likely in parts of eastern Africa and the Central Plains of the United States.
Forecasts for the last months of 2015 are also showing typical strong El Niño signals, including above-average precipitation in central-southwestern Asia, far eastern Asia, and southeastern South America. See forecast maps through the November-January season on our seasonal forecast page.
Learn more about El Niño on our ENSO resources page, and sign up here to get notified when the next forecast is issued. In the meantime, check out #IRIforecast or use #ENSOQandA on Twitter to ask your El Niño questions.
You must be logged in to post a comment.