January Climate Briefing: La Niña on Last Legs
Read our ENSO Essentials & Impacts pages for more about El Niño.
Tony Barnston provides an overview of the briefing
Since last month’s briefing, sea-surface temperature anomalies in the area of the central equatorial Pacific Ocean that define El Niño and La Niña events, called the Nino3.4 region, have warmed about a tenth of a degree. The past few weeks, these anomalies have been in the -0.3ºC to -0.5ºC range, hovering on the warm side of the -0.5ºC threshold indicative of La Niña. The first image below shows the latest week’s anomalies.
These sea-surface temperatures (SSTs) point to a weakening La Niña event, but since La Niña events involve both oceanic and atmospheric components, the latter must also be considered. The strongest indication that the atmosphere has also been also active in this event is the convection pattern that has lasted in the equatorial Pacific for the last several months (see second image in gallery). This pattern is what is most likely to in turn influence precipitation patterns around the world.
As we have been reporting since September, some La Niña-like impacts are expected to occur regardless of whether a La Niña is officially declared; the -0.5ºC threshold is a guideline for impacts, but not an absolute. These impacts are looking much less likely, however, for the upcoming seasons. The La Niña advisory issued in November by the National Oceanic and Atmospheric Administration’s Climate Prediction Center is still in effect.


To predict El Niño, computers model the SSTs in the Nino3.4 region over the next several months. The graph in the first image of the gallery below shows the outputs of these models, some of which use equations based on our physical understanding of the system (called dynamical models), and some of which use statistics, based on the long record of historical observations.
The mean of the dynamical and statistical models calls for SST conditions to gradually warm. These models call for SST anomalies to reach 0ºC in the February-March-April season — a bit earlier than the model runs from the last few months.
Beginning with the June-July-August season, the dynamical models call for SST anomalies to approach the El Niño threshold of +0.5ºC. This season, however, comes after what’s known as the spring predictability barrier — a function of ocean dynamics that makes it hard to predict ENSO past June of each year, so uncertainty is high. The statistical models are showing SST anomalies staying close to 0ºC.


Based on these model outputs, odds for La Niña are down dramatically for the next several seasons, with neutral conditions dominating (see second graph in gallery above). The warmer SSTs shown in the plume graph are reflected in the increasing likelihood for El Niño conditions later in the year.
La Niña in context: Resource page on climate variability
The official probabilistic forecast issued by CPC and IRI in early January shows a similar overall pattern, with somewhat higher odds for La Niña conditions (but still less than 50%) for the next few months. This early-January forecast uses human judgement in addition to model output, while the mid-January forecast relies solely on model output.
Effects of La Niña on global seasonal forecasts
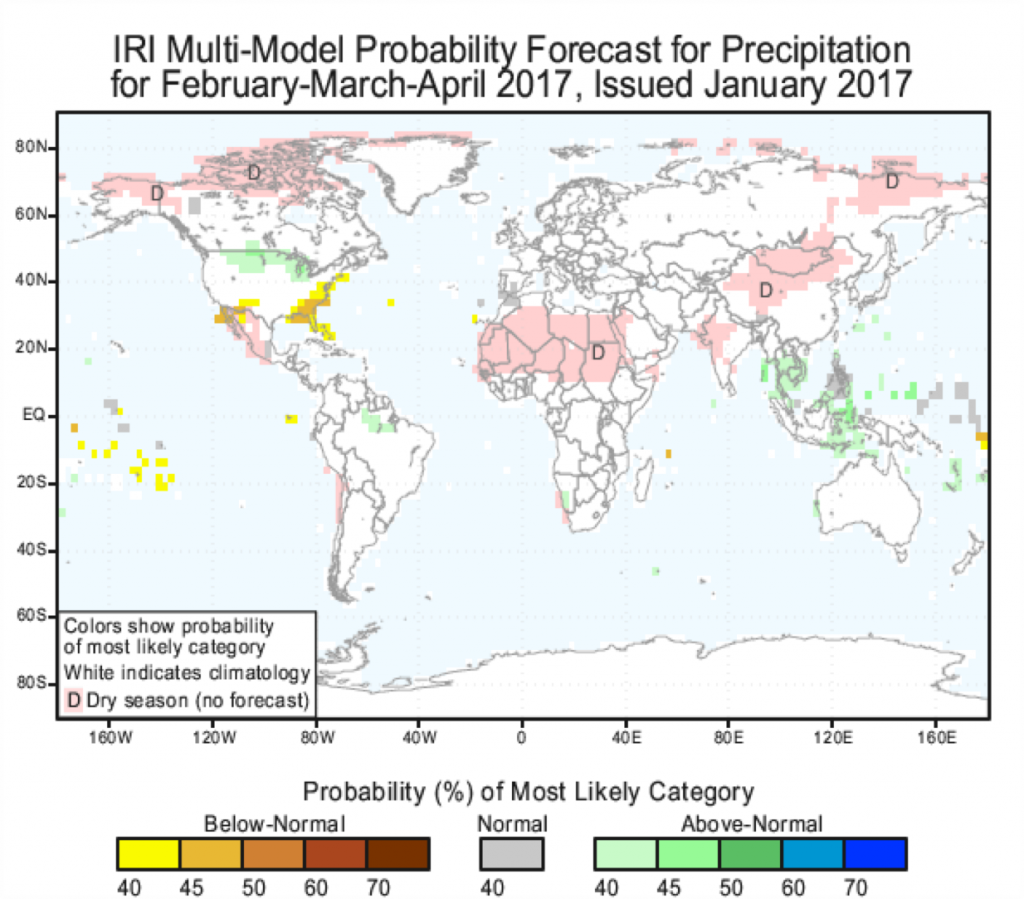
Each month, IRI issues seasonal climate forecasts for the entire globe. These forecasts take into account the latest sea-surface temperature projections and indicate which areas are more likely to see above- or below-normal temperatures and rainfall.
Please refer to our licensing agreement for permission to use any IRI forecast material.
For the upcoming February-April period, the forecast shows a moderate likelihood of drier-than-normal conditions in the southeastern United States. The February-April forecast also shows an somewhat enhanced chance of above-average precipitation in some areas of Southeast Asia.
The impacts listed above are specifically for the February-April season. Later seasons show even less predictable impacts, reflecting the neutral state of the ENSO forecast. Find additional forecast maps on our seasonal forecast page.
Learn more about La Niña on our ENSO resources page, and sign up here to get notified when the next forecast is issued. In the meantime, check out #IRIforecast or use #ENSOQandA on Twitter to ask your La Niña questions.
You must be logged in to post a comment.