What is Climate Variability?
Additional resources
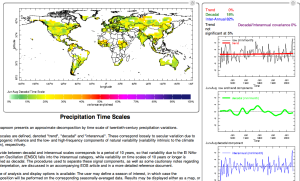
- IRI Timescales Maproom – See how climate breaks down between long-term, decadal and annual trends
- The World Meteorological Organization’s page on Significant Natural Climate Fluctuations
Much of the work done at IRI is related to climate variability, which is defined by the World Meteorological Organization as “variations in the mean state and other statistics of the climate on all temporal and spatial scales, beyond individual weather events.” In simpler terms, variability is the range of climate compared to its average. The fluctuations comprising climate variability can influence patterns of rainfall, temperature and other variables on timescales anywhere from a few weeks to a few decades.
While the long-term trends of climate change are considered by scientists to be largely human-caused, climate variability is mostly due to natural oscillations in the earth’s systems (though there are some proposed exceptions). At its most fundamental, climate variability stems from the redistribution and changes in the amount of energy around the globe, which lead to changes in pressure, temperature and other climate variables. The amount and movement of energy result from a multitude of factors, including those external to earth’s system (e.g. the amount of radiation emitted from the sun) and internal (e.g. volcanic activity blocking some solar radiation from reaching the earth’s surface). Thus the weather at any given place and time will be influenced by a number of climate variability factors, some of which we can pinpoint, and some of which we have yet to discover.
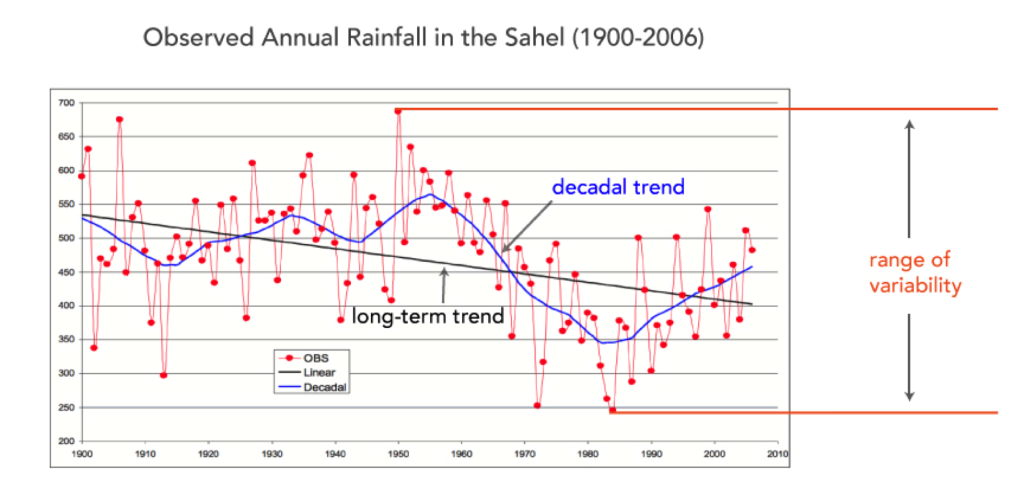
Figure 1: Annual rainfall in the Sahel from 1900 to 2006, adapted from Mason et al, 2015. The red dots indicate the yearly observations, so the red line indicates variation in climate from year to year (also know as interannual variability). ENSO (see below) is a major influence of interannual variability for many places, especially in the tropics. The blue line represents decadal variability, or the trends in climate that occur over the span of 10-30 years. These clusters of relatively wet or dry years can result in prolonged drought or flooding. The Sahel droughts of the 1970s and 80s show up at this timescale, indicated by the dip of the blue line in this graph. Sometimes trends on the decadal timescale can be counter to long-term trends (>30 years). While a long-term trend is apparent in this dataset (black line), long-term trends caused primarily by climate change are generally more apparent for temperature than rainfall, which tends to be more variable.
One of the most well understood sources of climate variability is the tilt of the earth, which causes the seasonal changes in climate in the northern and southern hemispheres. Another major influence on climate variability is sea-surface temperatures (SSTs). The vast amount of energy held in our oceans means that even slight changes in SSTs can shift certain climate patterns.
Scientists do not always know how a chain of events plays out in the ocean and atmosphere. They can, however, use statistical methods and physically-based climate models to find links between, for example, SSTs in one area of the ocean and patterns of wetter, drier, warmer or cooler climate in another area (usually over land). When scientists discover a correlation between SSTs and a climate pattern (e.g., Atlantic SSTs and western Amazon rainfall), the possibility opens up to use the SSTs to predict that climate pattern. Armed with an informative prediction, decision makers in climate-affected sectors like agriculture, health and disaster risk reduction can use the climate information to prepare for a period of climate that is likely to be above or below normal.
One of the sources of internal climate variability about which scientists know the most is the El Nino-Southern Oscillation (more on ENSO here). But there are others, most of which are associated with higher or lower than normal sea-surface temperatures or pressures in defined areas. Below are descriptions of some of the major climate variability oscillations scientists have identified. These are all oscillations that are presumed to be caused naturally and are internal to the earth’s system (i.e. not due to changes in incoming solar energy or greenhouse gas emissions).
ENSO
The El Niño-Southern Oscillation (ENSO) describes the natural year-to-year variations in the ocean and atmosphere in the tropical Pacific that lead to large-scale changes in sea-level pressures, sea-surface temperatures, precipitation and winds–not only in the tropics but across many other regions of the world. An El Niño state occurs when the central and eastern equatorial Pacific sea-surface temperatures are substantially warmer than usual (see Figure 1, top). La Niña conditions (also part of the ENSO cycle) occur when the central and eastern equatorial Pacific waters are substantially cooler than usual (see Figure 1, bottom).
The most direct effects of ENSO on regional climate patterns are found in those areas closest to the tropical Pacific, but El Niño and La Niña are such powerful forces that they can shift seasonal temperature and precipitation patterns around the globe. While scientists have shown that the occurrence of floods, droughts and other climate-related disasters is not statistically different among years with El Niño, neutral or La Niña conditions, such disasters may be more predictable, allowing decision makers to take action and prepare for such events. Much more on ENSO here.
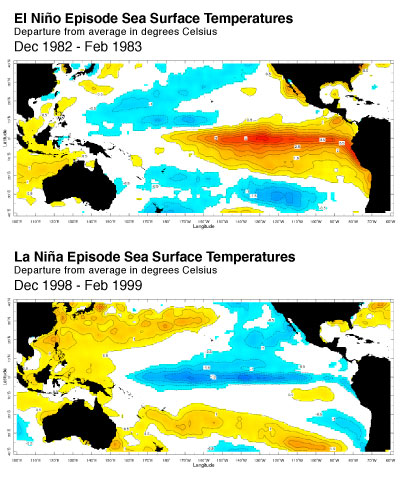
Figure 2: Sea-surface temperature anomalies during a strong El Niño event (top) and La Niña event (bottom). Click image to enlarge. Source: IRI Data Library Maproom
PDO
Moving north a few thousand miles, the Pacific Decadal Oscillation is defined by sea surface temperature anomalies in the higher latitudes of the Pacific. While PDO also has a warm phase and cool phase, the timescale on which PDO fluctuates is not as defined as ENSO (it can persist in either phase for anywhere from 10-40 years). During the warm, or positive, phase, the northwest Pacific is relatively cooler and the eastern Pacific warmer. The inverse pattern appears during the cool, or negative, phase.
The term PDO was coined in 1996 by Steven Hare, a researcher studying the influence of the Pacific on Alaskan salmon fisheries. The coastal northwestern portion of North America sees some of the strongest impacts of PDO, with generally more rainfall during a positive PDO phase and less during a negative phase. Influence on climate in other parts of North America, as well as Australia and India has been shown. Given its long phases and relatively recent discovery, scientists don’t know as much about the processes that give rise to these fluctuations compared to other climate variability sources. Areas of active research include its interaction with ENSO, role in the recent “global warming hiatus”, and connection to variability in the Atlantic Ocean.
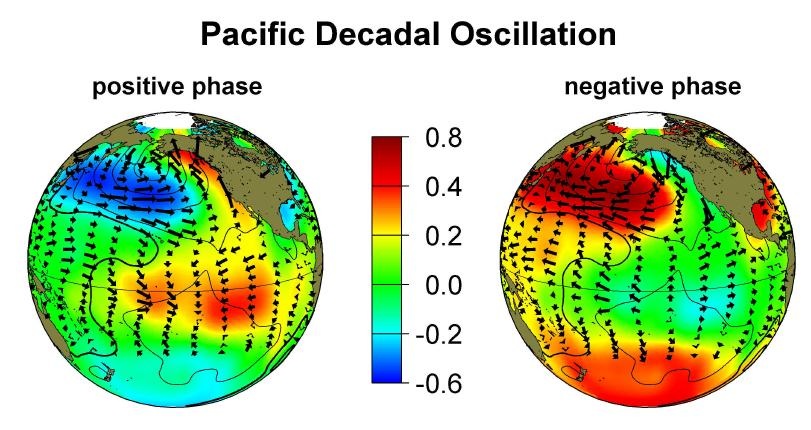
Figure 3: The two phases of PDO as exhibited by sea surface temperature patterns in the Pacific. Source: jisao.washington.edu
AMO
The Atlantic Multidecadal Oscillation (AMO) is a mode of variability defined by sea surface temperatures in the North Atlantic. It is a longer-term source of variability, with only a few shifts between its warm and cool phases in the 20th century. Scientists have linked it to temperature and rainfall patterns in North America and Europe, as well as Brazil, the Sahel and India. Research also shows that the AMO influences hurricane activity in the Atlantic.
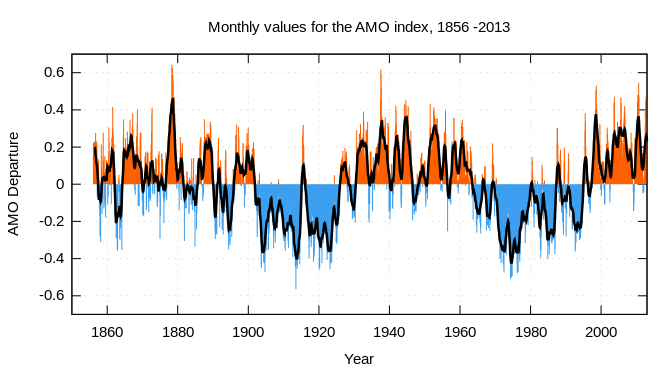
Figure 4: Atlantic Multidecadal Oscillation index computed as the linearly detrended North Atlantic sea surface temperature anomalies 1856-2013. Source.
NAO
The North Atlantic Oscillation (NAO) is measured by air pressure. Low pressure generally resides over Greenland, while an area of high pressure camps out further south in the central North Atlantic. When NAO is in a positive phase, these areas of pressure are reinforced; the low pressure area is lower than its mean, and the high is higher. When NAO is in a negative phase, each area of pressure is weaker than normal. The NAO changes phase more frequently than many other climate oscillations, and it varies on timescales from days to decades to points in between. The positive phase usually results in more frequent and stronger winter storms tracking across the Atlantic, and thus warm and wet winters in Europe. The negative phase corresponds with more cold outbreaks in the eastern United States. These are just a few of NAO’s climate effects. More information on NAO is available here.
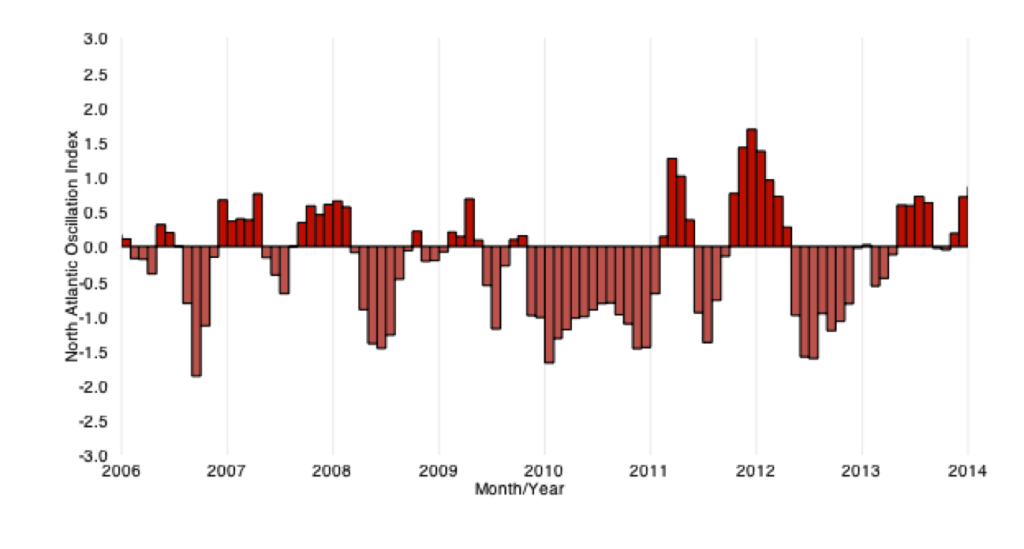
Figure 5. Monthly values of the North Atlantic Oscillation Index. Source: NOAA.
MJO
The Madden-Julian Oscillation (MJO) is a convective wave (i.e. an area of clouds, winds and rains) that propagates around the world, always from west to east and originating in the eastern Indian Ocean. It thus differs from the rest of the climate variability sources in this list, which all operate primarily in a smaller, defined area, though their effects can be far-reaching.
MJO has two phases, one which produces enhanced convection and one which suppresses convection. So, as MJO moves around the globe, it brings with it both heavier rainfall and periods of dry weather, returning to its origination point after 30-60 days. The tropics see the strongest effects, but MJO’s influence can extend to higher latitudes as well. More on MJO here.
Figure 6: An animation illustrating the organization of the MJO into its enhanced and suppressed convective phases during an MJO event during the spring of 2005. The green shading denotes conditions favorable for large-scale enhanced rainfall, and the brown shading shows conditions unfavorable for rainfall. The MJO becomes organized during late March through May as the green shading covers one half of the planet, and brown shades the other half all along as these areas move west to east with time. Notice how the shading returns to the same location on the order of about 45 days. From NOAA/Jon Gottschalck.
You must be logged in to post a comment.