New data and tools bring a deeper understanding of El Niño
Updated maps document expected impacts of ENSO conditions for decision makers across the globe.
In 2001, the International Research Institute for Climate and Society’s Simon Mason and Lisa Goddard published an important analysis of how El Niño and La Niña events historically have influenced rainfall around the world. Out of that analysis they produced a set of influential maps to illustrate these ‘teleconnections’, as they’re called. The maps have been widely used and disseminated by humanitarian organizations, government ministries and media organizations to better understand and anticipate the global, regional and local consequences of ENSO.
Columbia University graduate student Nathan Lenssen has been working with Goddard, his Ph.D. advisor, and Mason to update their 2001 work with two decade’s worth of additional data and understanding about El Niño and La Niña. They published their results in the journal Weather and Forecasting in September.
In the Q&A below, Lenssen delves into the motivation behind the update.
Why was the work by Mason and Goddard so influential? Why is it important now to update these tools?
The maps that Simon Mason and Lisa Goddard generated were important because they provided a high-resolution, global analysis of how El Niño and La Niña events impact precipitation for every season. They summarized these impacts, called ENSO teleconnections, in easy-to-interpret maps. By looking at these maps, users could quickly determine the typical effect of El Niño or La Niña on precipitation across the world.
Importantly, their methods did not assume that ENSO’s effect on precipitation was linear, i.e., that a location that experiences greater-than-normal rainfall during El Niño years should experience less-than-normal rainfall during La Niña years. By doing it this way, they were able to detect some teleconnections that previous methodologies couldn’t pick up.
The study we just published updates this work and provides the scientific community with a new global, high resolution dataset that quantifies the historical precipitation impacts of ENSO. We have an additional 20 years of data since that original study, extending the analysis to cover the period from 1951 through 2016, which adds numerous strong ENSO events, like the 2015-16 El Niño and the 2010-11 La Niña. In addition to adding in more data, we improved the underlying method that accounts for uncertainty in the datasets. This allowed us to screen out missing data and increase the power of our statistical method. With these improvements, we were able to detect many new El Niño and La Niña teleconnections not found in the original 2001 analysis.
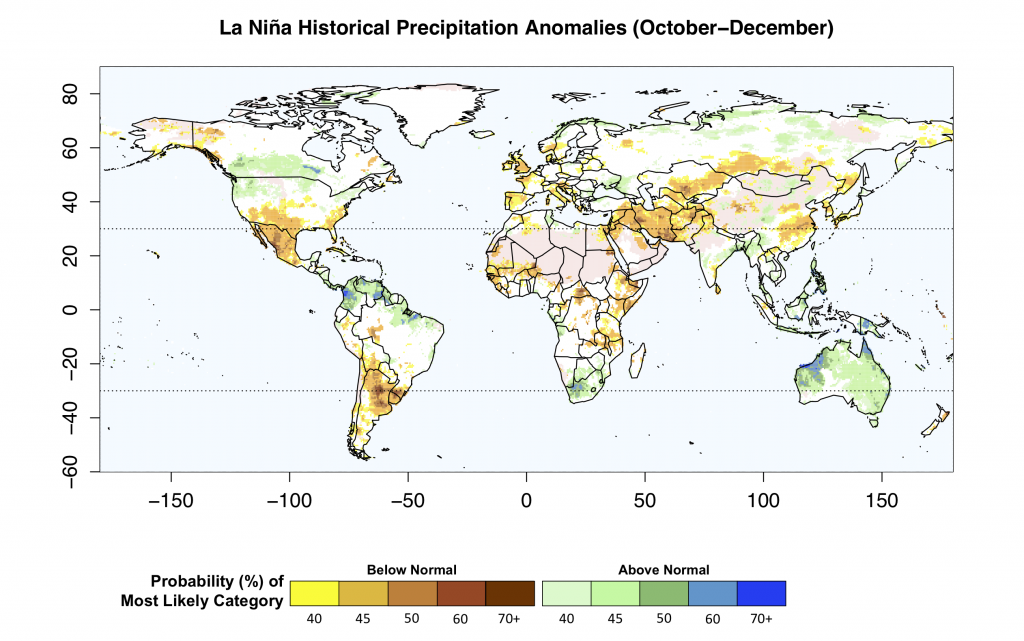
New maps based on an updated analysis of the impacts that El Niño (top) and La Niña (bottom) events have on global precipitation patterns.
ENSO events are important drivers of seasonal rainfall and temperatures. What impact does the updated analysis have on seasonal climate forecasting?
Our study uses simple seasonal forecasts that emulate forecasts users may make with ENSO teleconnection maps. Verification of these simple forecasts allows us to compare the performance of the IRI seasonal forecast with much simpler, but more accessible, seasonal forecasting techniques that are often used in practice.
The study provides a few important results to the seasonal forecasting community. First, we show that simple representations of ENSO teleconnections can be useful forecasts in of themselves. It is our hope that these maps and the associated skill analysis serves as a tool for forecasters and other scientists working in climate services to communicate the effects of ENSO, the need for uncertainty in seasonal forecasts, and the value of simple and state-of-the-art seasonal forecasts.
Second, it emphasizes the need to communicate the uncertainty of seasonal forecasts. We found that simple seasonal forecasts that quantify uncertainty through probability statements have greater skill than comparable simple forecasts that do not.
Finally, we have created a dataset of these simple forecasts to serve as a meaningful benchmark for further development of seasonal-forecast systems. Evaluating the skill of forecasts relative to historical impacts provides a higher and more meaningful bar. Adoption of these maps in the verification of seasonal forecasts by researchers who develop seasonal climate prediction systems at the IRI and at other centers will result in better identification of regions where seasonal forecast systems excel and need improvement.
Why is it important that forecasts be “translated”? What are some examples of the sorts of audiences and needs do these forecast adaptations address?
Interpreting probabilistic information is difficult in the best of circumstances and many potential users of seasonal forecasts do not have the expertise in climate science to apply the output of the IRI seasonal forecast to their specific question. Translation of a forecast is taking the forecast output and putting it in a form that makes it applicable to a real-world problem. A forecast that says it is most likely best to plant more corn than normal this year is much more actionable than a forecast that says there is a 60% chance of more rain than normal this growing season.
This study was motivated by people at the IRI observing that many end-users rely on simple ENSO teleconnection maps to make forecasts. When it is announced El Niño is coming, some users will look at one of these maps and use the marked anomaly for their decision making.
In our study, we sought to determine how good these forecasts were, when they were inferior to the IRI seasonal forecasts, and when the teleconnection maps were sufficient. We found that for most of the tropics, using the teleconnection map was better than no forecast at all, but that the IRI forecast almost always resulted in a better forecast. The finding that the teleconnection maps perform better than no forecast and very well in some regions allows the further development of simplified seasonal forecasts products tailored for specific regions.
You must be logged in to post a comment.