January Climate Briefing: El Niño Development Wavers But Odds Remain High
This briefing update was written by Elisabeth Gawthrop and Jacquelyn Turner.
Read our ENSO Essentials & Impacts pages for more about El Niño and La Niña.
Tony Barnston provides an overview of the briefing:
What’s New
Sea-surface temperatures in the equatorial Pacific have cooled slightly since this time last month. The SST conditions of the Niño3.4 region, shown in tweet image below, are used as key metric when evaluating the status of El Niño and La Niña. Since late September, that metric has been pointing towards El Niño. Averaged over the last four weeks, the SST anomaly in the Niño3.4 region was +0.5ºC, right on the borderline of neutral conditions and weak El Niño conditions.
The Niño3.4 metric is also what’s used in forecasting El Niño and La Niña status. The probabilities shown later in this blog reflect only the chance that the SST anomaly in that area will be at or above +0.5ºC. But Niño3.4 doesn’t summarize the whole El Niño story. Certain conditions in the atmosphere must also change for the impacts of El Niño to propagate through the global climate system.
Often, if the ocean begins to exhibit El Niño characteristics, the atmosphere will follow suit, but so far in this event, that hasn’t really happened. Most atmospheric indicators currently suggest neutral conditions — neither El Niño nor La Niña. The exception right now is the convection (i.e. rainfall) pattern in the equatorial Pacific — it’s starting to look a little more like what we might see during El Niño. Barnston said there have been cases in the past where that convection pattern doesn’t appear until February during an El Niño cycle, so it’s possible this event could still rally. But by then, many of the strongest known El Niño climate impact signals are fizzling out.
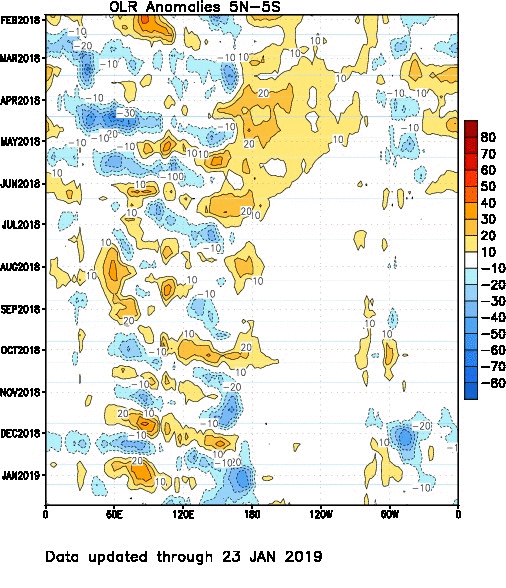
The Madden-Julian Oscillation is another mode of climate variability that also influences convection in the equatorial Pacific, and can in turn influence the development or demise of El Niño events. A recent MJO event produced conditions counter to El Niño development and likely contributed to the recent weakening of warm SST anomalies.
ENSO Forecasts
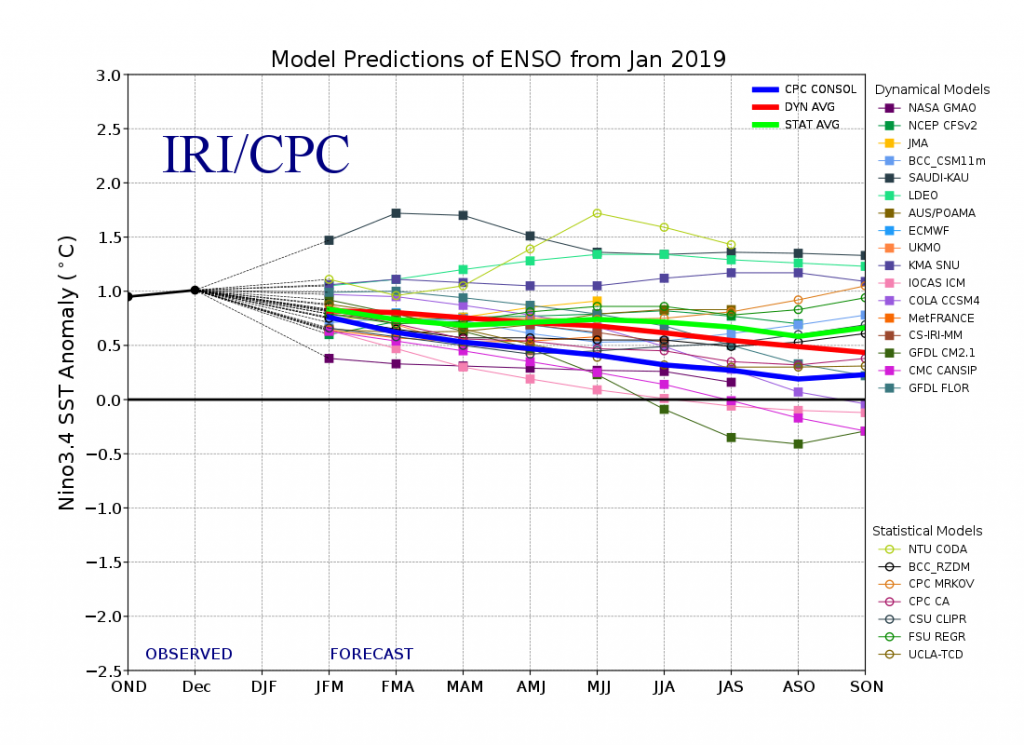
To predict ENSO conditions, computers model the SSTs in the Nino3.4 region over the next several months. The plume graph below shows the outputs of these models, some of which use equations based on our physical understanding of the system (called dynamical models), and some of which use statistics, based on the long record of historical observations.
The models’ predictions are on the whole slightly cooler than last month’s data. The dynamical models are showing a more dramatic weakening predicted in the latter part of the forecast period compared to what was predicted last month. Nonetheless, the mean of both dynamical and statistical models stays above the weak El Niño threshold of +0.5ºC through most of the forecast period.
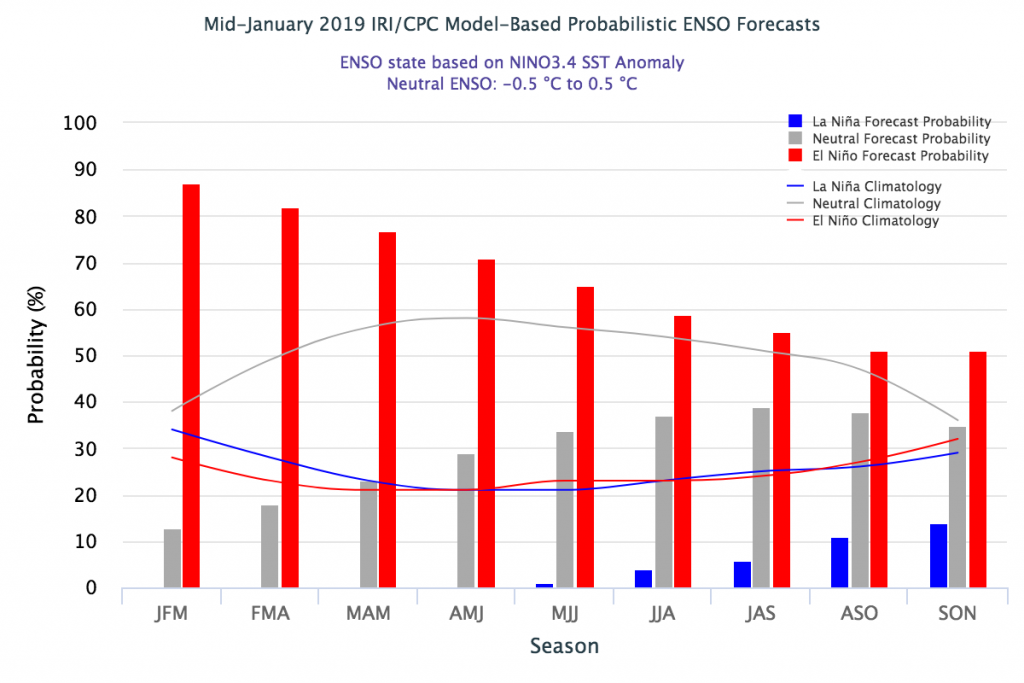
The probability for El Niño is also down some from last month, but still above 80% for the next several months. The El Niño odds are similar for the next few months in the official probabilistic forecast issued by CPC and IRI in early January than in this mid-month CPC/IRI forecast. This early-January forecast uses human judgement in addition to model output, while the mid-month forecast relies solely on model output. In early January, there had not yet been several weeks of weakened Niño3.4 SSTs, which will likely influence the next official forecast to be issued in a couple of weeks. More on the difference between these forecasts in this IRI Medium post.
ENSO in context: Resource page on climate variability
IRI’s Global Seasonal Forecasts
Each month, IRI issues seasonal climate forecasts for the entire globe. These forecasts take into account the latest model outputs and indicate which areas are more likely to see above- or below-normal temperatures and precipitation.
For the upcoming February – April season, odds are moderately to strongly tipped in favor of below-normal precipitation for the Philippines, western and northern coastal Australia and parts of Indonesia. Slight odds for below-normal precipitation are showing up in southern Africa, southern South America and Central America, as well as some smaller spots around the globe.
All forecast maps, including temperature in addition to precipitation, and also including a description of the methodologies, are available on our seasonal forecast page. Additional forecast formats, such as our flexible forecast maproom, are available in the IRI Data Library.
Learn more about El Niño and La Niña on our ENSO resources page, and sign up here to get notified when the next forecast is issued. In the meantime, check out #IRIforecast.
You must be logged in to post a comment.