Flexible Forecasts: Responding to User Needs
Innovative flexible temperature and precipitation forecasts are among a broad suite of tools available as part of the International Research Institute for Climate and Society’s Map Rooms.
How are these forecasts used, and what makes them “flexible”?
Flexible forecasts offer an alternative to traditional three-category, or tercile, climate forecast maps, which indicate the probability that temperatures or rainfall in a region will fall into one of three categories — above-normal, below-normal or near-normal — during a specified period. For tercile forecasts, the three categories are defined using historical climate data in a region. All the past years are ranked in order of rainfall (or temperature) and one-third are placed into each category to create a distribution. Thus the default probability for any one of the categories is 33.3%. If climate models indicate that patterns for an upcoming season are likely to cause more or less rainfall (or higher or lower temperature), scientists adjust the probabilities for each category in the seasonal forecast.
For example, a decision maker may wish to consider the three-month precipitation forecast for southern Brazil and Uruguay during the current September to November season, as shown below. The tercile forecast here shows a 40-45% chance of above-normal precipitation during this period in the area circled in red—not surprising, given that an El Niño event is likely to develop later in the year. The forecast indicates that something in the climate system (e.g. El Niño) is pushing the odds for above-normal precipitation over the 33.3% default.
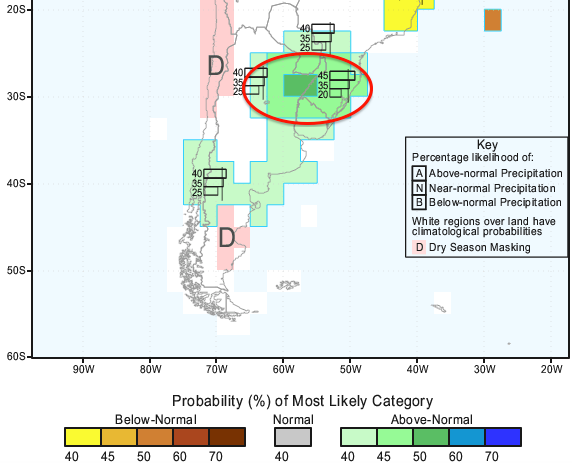
Tercile forecast showing a 50% probability of above-normal precipitation in Uruguay, southern Brazil and northeastern Argentina during Sep-Nov 2014. (IRI Map Room)
But herein lies the difficulty with the tercile format: when a prediction indicates a 45% chance of above-normal rainfall as in this example, a decision maker can’t gauge how far above average that rainfall is expected to be over that three-month period. The forecast only predicts the likelihood that temperatures or rainfall will be in the lower, middle, or upper third of the historical climatological distribution.
Flexible forecasts help fill this information gap by determining the probability that rainfall will exceed a certain percentile in the normal, or average, precipitation distribution of a region.
Using the example from above, we can calculate the likelihood that rainfall will exceed the 80th percentile of its normal distribution in southeastern South America, which might be more relevant to a decision maker. Shown in this format, we see there’s about a 35% chance that seasonal rainfall totals will be above the 80th percentile. Put another way: there’s about a 35% chance that the amount of rainfall expected will be similar to the top 20% wettest years of that area’s historical record.
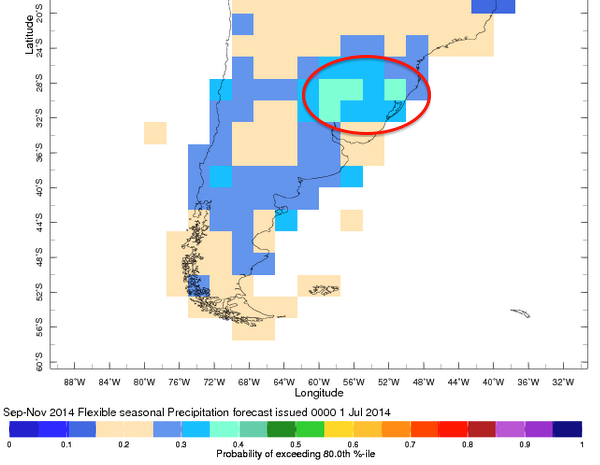
Map showing the probability that seasonal precipitation will exceed the 80th percentile with respect to an average rainfall distribution. The red circle on the map shows a 30-40% chance of rainfall exceeding the 80th percentile during the Sep-Nov 2014 season over southeastern South America. (IRI Map Room)
An interactive forecasting tool
Each grid point on the map is generated by an ensemble of global climate models that have been carefully calibrated and combined to create a seasonal forecast. By clicking any point on the global map, users can see how much the forecasted temperature or rainfall distribution is expected to shift with respect to normal climatology (as seen below). The flexible forecast tool also allows users to change the parameters to physical units. For example, a local water manager in Uruguay may need to know the probability that seasonal precipitation will exceed (or not exceed) a certain threshold, such as 3 millimeters per day over a three-month period.
A similar query is available for temperature, where map room users can see the likelihood that the average seasonal temperatures will exceed a certain threshold during the three-month forecast period.
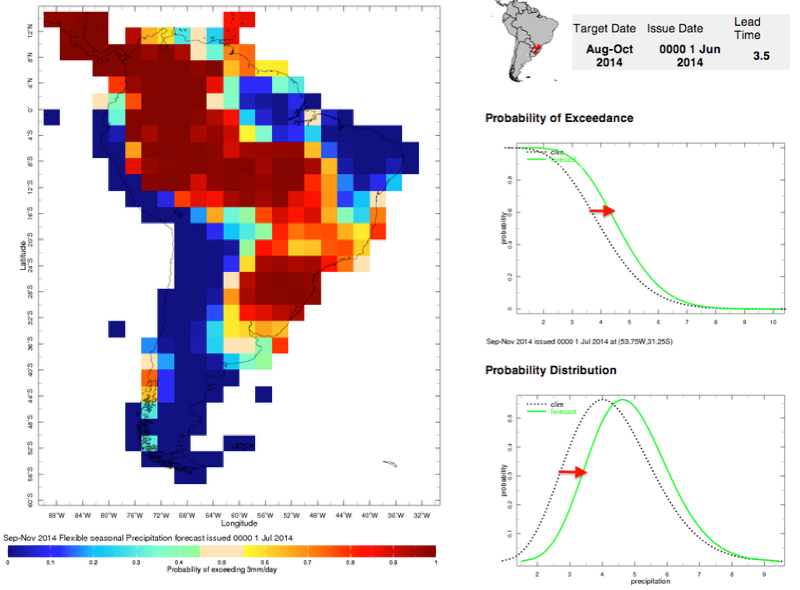
This gridded map shows the probability that rainfall will exceed 3 mm/day across South America. The panel to the right shows how the rainfall distribution is expected to shift compared with normal climatology. (IRI Map Room)
Why use flexible forecasts?
Decision makers in agriculture, public health or the water management sectors are often most concerned about climate extremes, wanting answers to questions such as ‘What’s the likelihood that rainfall over the next three months will end up in the top 10% of wettest or driest years?’. Public health officials may be interested in the likelihood of precipitation exceeding the 80th percentile to assess malaria risk in southern Africa, while farmers in India may alter their crop allocation if there is a higher likelihood of temperatures or rainfall well outside the normal range.
The “probability of exceedance” concept has been well received in the agricultural sector. IRI’s Jim Hansen, a team leader within the CGIAR Research Program on Climate Change, Agriculture and Food Security, has led workshops in East Africa to help farmers understand seasonal probability shifts in rainfall due to climate variability and long-term climate change.
“While we have yet to formally evaluate how these forecasts enhance decision making, when we’ve introduced the flexible-style forecasts to the agricultural community, the response has been quite good,” said Hansen.
Hansen explained that farmers assess risk based on the full spectrum of climate conditions, including the middle and the “tails” of a probability distribution. Flexible forecasts are a useful decision-making tool because they provide the likelihood that rainfall or temperature outcomes will end up closer to normal or toward the extremes with respect to a long-term average.
By using tailored seasonal forecasts, decision makers in agriculture and other climate-sensitive sectors can reduce the risk of negative outcomes associated with droughts, flooding and other extreme events. They can also use the tailored forecasts to take advantage of seasons when conditions are expected to be favorable for growing certain kinds of crops, for example, or for reallocating precious public-health resources to areas that will need them most.
You must be logged in to post a comment.