May Climate Briefing: El Niño Heating Up
From the May climate briefing, given by IRI’s Chief Forecaster Tony Barnston:
Tony Barnston provides an overview of the briefing
El Niño, a state of warmer-than-average sea surface temperatures in the tropical Pacific, has recently intensified, though scientists aren’t sure how strong the event will become. The El Niño phenomenon is part of a natural cycle of climate (and ocean) variability in the equatorial Pacific, known as El Niño Southern Oscillation (ENSO). The amount of energy absorbed and distributed by this area of ocean and atmosphere is so great that sustained sea surface temperatures even just a degree above average have cascading effects throughout the world. These effects lead to tendencies for certain areas to receive more or less rainfall than normal, and/or see warmer or cooler temperatures than is typical. Although for some areas this can mean floods, drought or other extreme weather, the predictability associated with El Niño can afford decision makers the chance to be better prepared for such events. In some areas, the odds for changed weather patterns may have benefits, such as drought relief. Read on for details about the latest forecast, and see our ENSO Essentials and ENSO Impacts pages for more background on this climate variability pattern.
The IRI/CPC probabilistic ENSO forecast issued mid-May 2015. Note that bars indicate likelihood of El Niño occurring, not its potential strength. Unlike the official ENSO forecast issued at the beginning of each month, IRI and CPC issue this updated forecast based solely on model outputs. The official forecast, available at http://1.usa.gov/1j9gA8b, also incorporates human judgement.
Changes from last month’s briefing
Over the last month, the ongoing El Niño in the central Pacific has strengthened from weak to weak/moderate, and the chance that such conditions will persist has risen since last month’s forecast. There is now a 97% chance of El Niño for the May-July season, and chances stay above 80% through the end of the year. It should be noted these odds only indicate the chance of at least weak El Niño conditions occurring, with no indication of strength. The El Niño advisory issued in March by the National Oceanic and Atmospheric Administration’s Climate Prediction Center and IRI is still in effect.
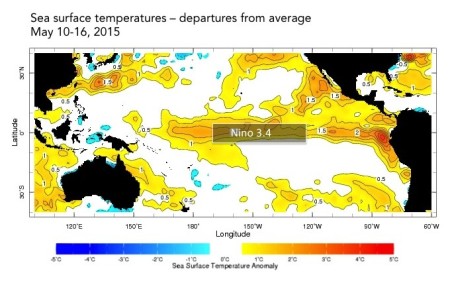
The sea-surface temperature anomaly last week in the Nino3.4 region (see second image) was 1.0ºC above average, well above the 0.5ºC mark considered to be a threshold indicator of El Niño conditions. To predict El Niño, computers model the SSTs in this region over the next several months. The third image shows the outputs of these models, some of which use our physical understanding of the system (called dynamical models), and some of which used statistics, based on the long record of historical observations. While the mean of the models calls for a moderate to strong El Niño, there is significant variation among the models. On average, the dynamical models forecast a stronger El Niño, with some reaching above a 2.5ºC anomaly. Of notable exception is the LDEO model, housed here at Columbia, which predicts a dip toward the 0ºC line. The statistical models favor a weaker El Niño on average. Overall, there is almost a 3ºC spread among the forecasts, leading to much uncertainty about the El Niño’s potential strength.
The pivotal month
May is one of the most critical months in the cycle of El Niño. It is smack in the middle of what forecasters call the spring predictability barrier. The state of the Pacific during this time is very dynamic and fluid, meaning that winds, temperatures and other atmospheric features can change relatively quickly. This makes it hard for scientists (and their computer models) to know if current conditions are a good indication of forecasts looking ahead. The forecasts from May 2014, for example, also called for El Niño development, although an El Niño was not declared until March 2015. This year, however, the Pacific is already in an El Niño state, increasing the likelihood that there will be some persistence, if not strengthening, of El Niño conditions.
The following graph shows forecasts made by dynamical and statistical models for SST in the Nino 3.4 region for nine overlapping 3-month periods. Note that the expected skills of the models, based on historical performance, are not equal to one another.
One key difference from last year at this time is the trade wind activity. For an El Niño to fully kick in, trade winds over some areas of the equatorial Pacific must be much weaker than normal, or even reverse in direction. In 2014, the unusual trade wind activity occurred from January to April, but during May, the trade wind patterns needed for El Niño began to fizzle. This year, the unusual trade winds started a little later and are still occurring. Their further continuation into June will be key for sustaining El Niño conditions.
Effects of El Niño on global seasonal forecasts
 Each month, IRI issues seasonal climate forecasts for the entire globe. These forecasts take into account the latest ENSO SST projections and indicate which areas are more likely to see above or below normal temperatures and rainfall. For the June-August period, the forecast continues to show a strong likelihood of drier-than-normal conditions over Indonesia, northeastern South America and parts of Central America and the Caribbean (image right). Wetter-than-average conditions are very likely in southern Brazil, Bolivia, Paraguay and central Argentina.
Of the sea-surface temperature models that go into the seasonal forecasts, one is predicting a dissipation of the current El Niño by the end of summer, one is predicting a moderate El Nino and one is predicting a strong El Niño. By next month, we will be at the tail end of the predictability barrier, and forecasters should have a better idea of the likely strength of this El Niño event.
Learn more about El Niño on our ENSO resources page, and sign up here to get notified when the next forecast is issued. In the meantime, check out #IRIforecast or use #ENSOQandA on Twitter to ask your El Niño questions.
You must be logged in to post a comment.