ENSO Forecast
CCSR/IRI ENSO Predictions Plume
Published: March 19, 2026
Note on interpreting model forecasts
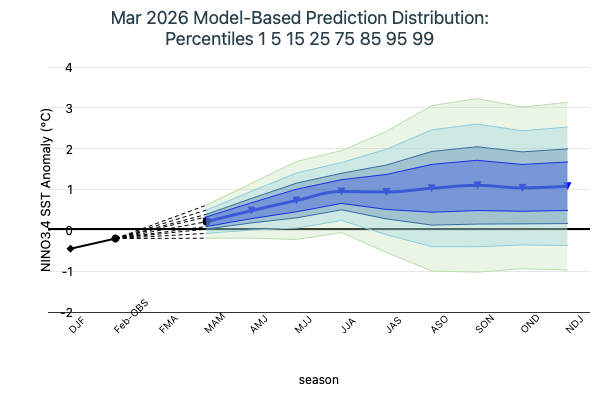
The following graph and table show forecasts made by dynamical and statistical models for SST in the Nino 3.4 region
for nine overlapping 3-month periods. Note that the expected skills of the models, based on historical performance, are
not equal to one another. The skills also generally decrease as the lead time increases. Thirdly, forecasts made at some
times of the year generally have higher skill than forecasts made at other times of the year--namely, they are better when
made between June and December than when they are made between February and May. Differences among the forecasts of the
models reflect both differences in model design, and actual uncertainty in the forecast of the possible future SST scenario.
Discussion of Current Forecasts
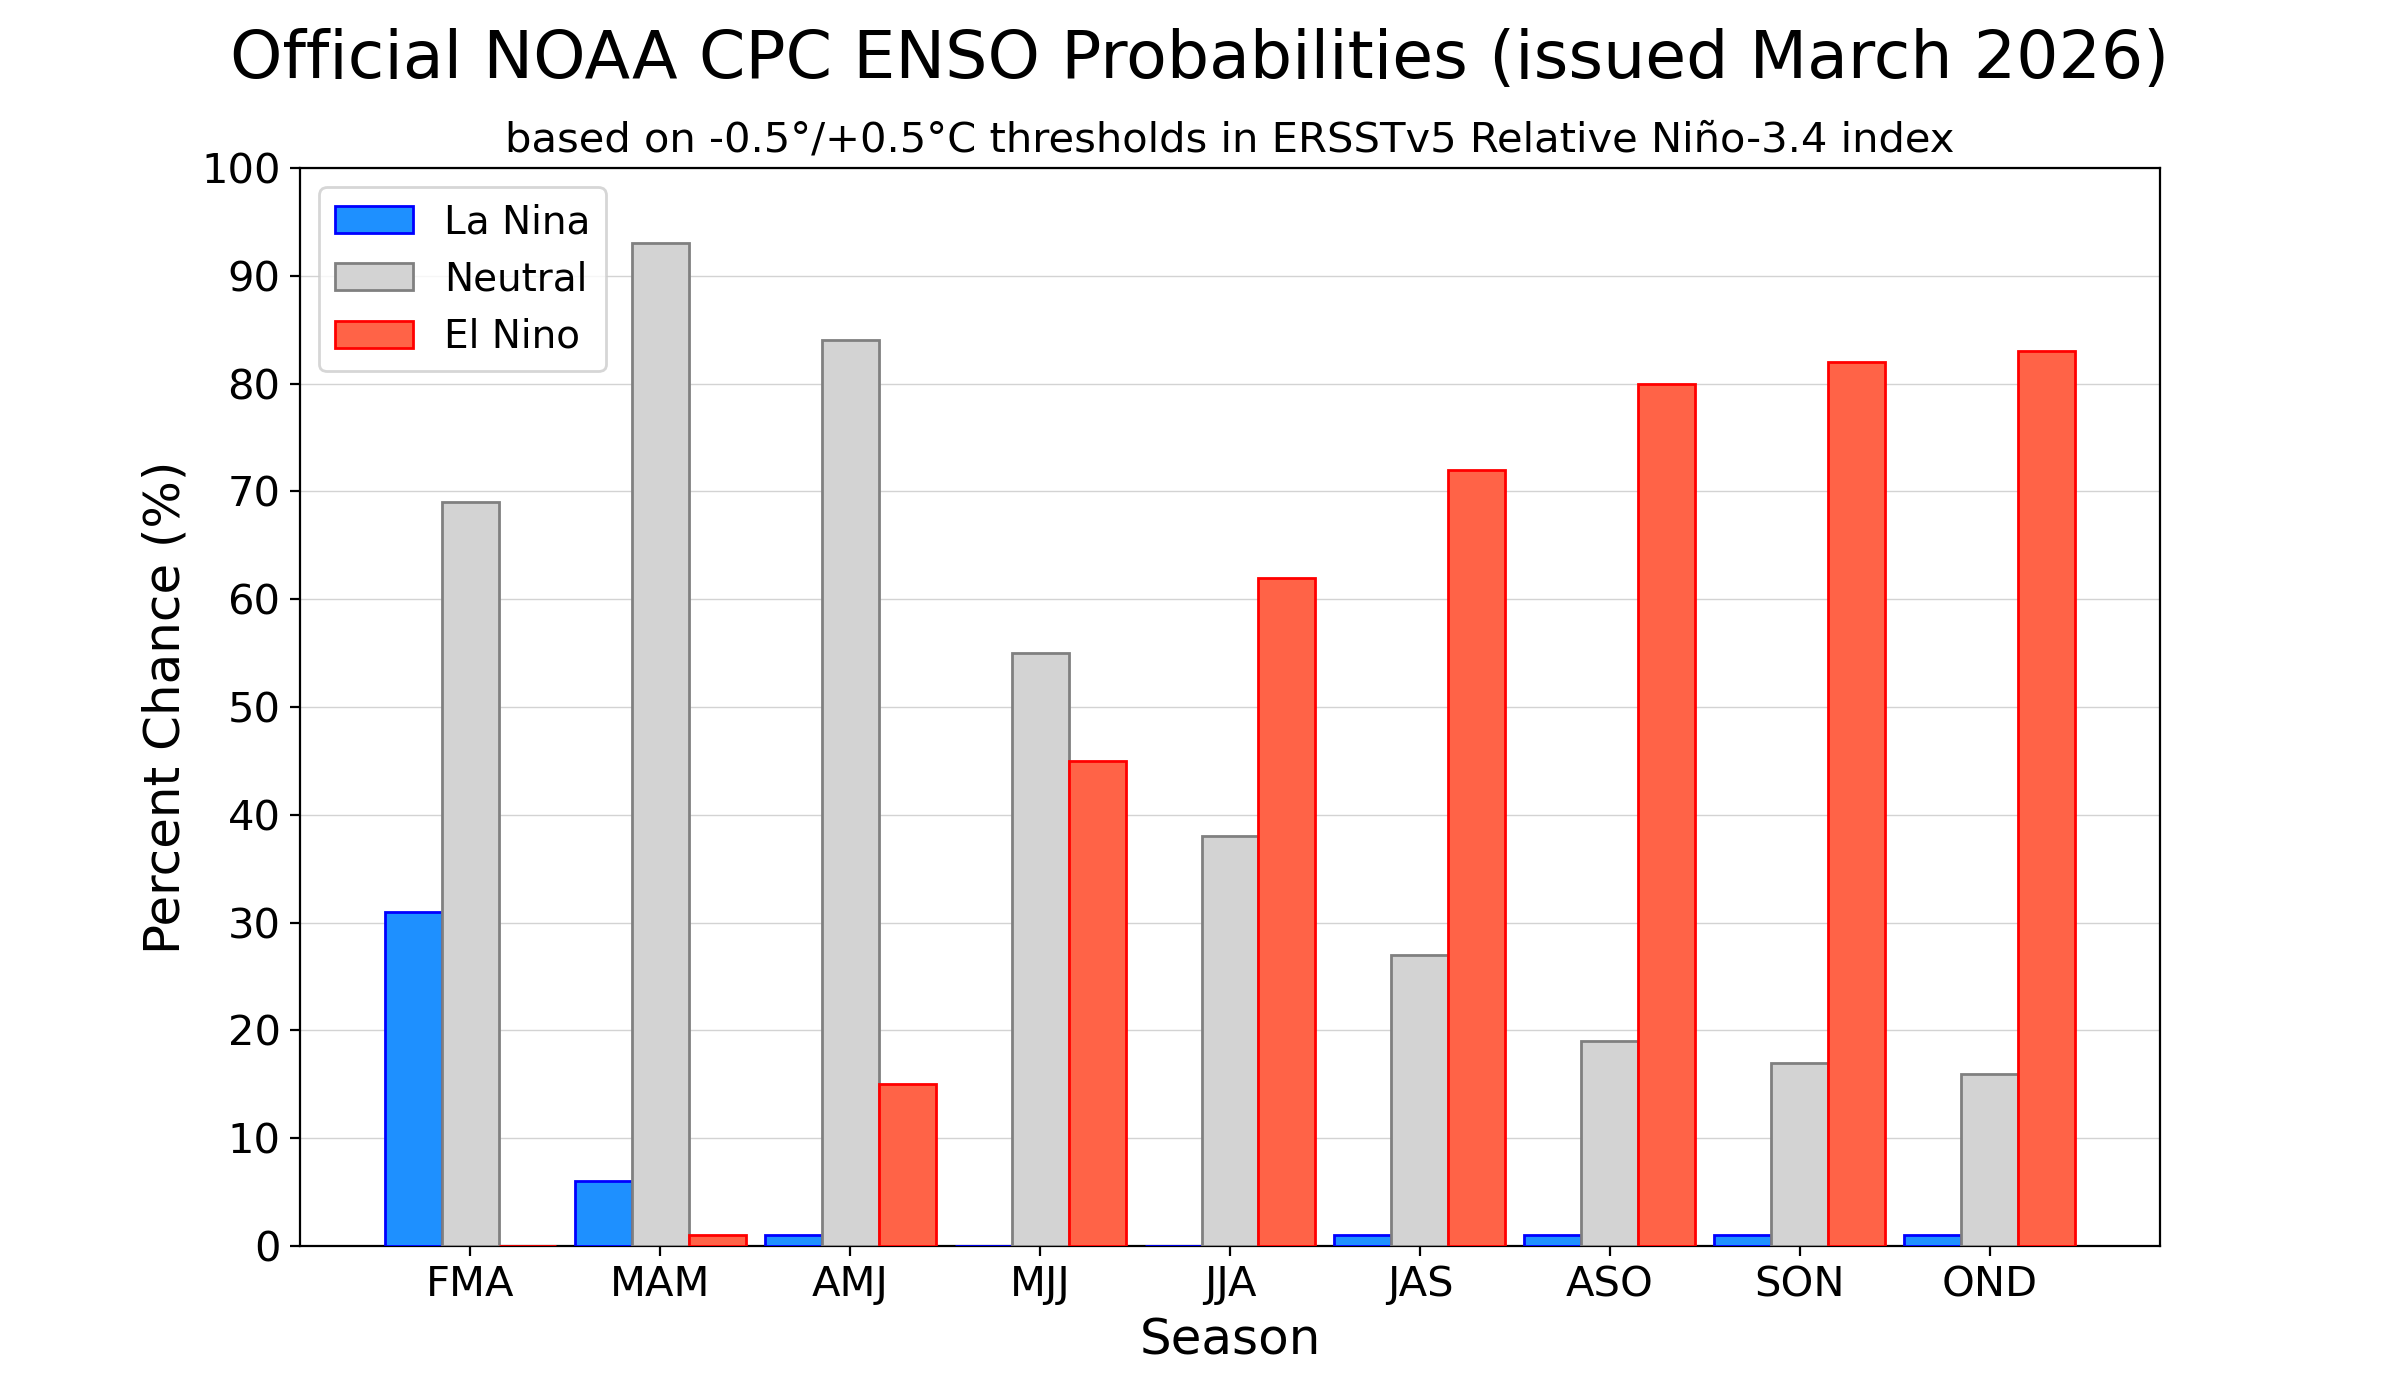
The CCSR/IRI ENSO prediction plume indicates a high likelihood of ENSO-neutral conditions during March–May 2026 (91% probability). The multimodel mean of statistical and dynamical models predict a decline in ENSO-neutral probability during February–April 2026 (53% chance), with a corresponding increase in El Niño probability to 47%.Going forward, El Niño is predicted to dominate with probabilities of 72–80%, while ENSO-neutral probabilities drop into the 20s and La Niña chances remain below 5% throughout the forecast period. Note that long-lead ENSO forecasts are highly uncertain, especially when crossing the spring predictability barrier. Based on the multi-model mean (Dynamical and Statistical models) prediction, and the expected skill of the models by start time and lead time, the probabilities (in %) for La Niña, ENSO-neutral and El Niño conditions (using -0.5 °C and 0.5 °C thresholds) over the coming 9 seasons are:
Summary of forecasts issued over last 22 months
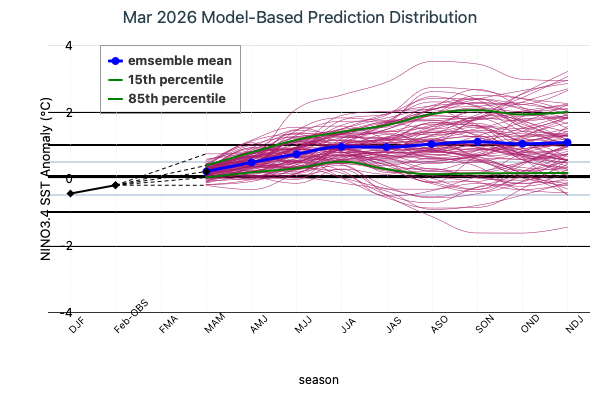
The following interactive plot shows the model forecasts issued not only from the current month (as in the plot above),
but also from the 21 months previous to this month. The observations are shown up to the most recently completed
3-month period. The plots allow comparison of plumes from the previous start times, or examination of the forecast
behavior of a given model over time.
Hovering over any single model will highlight that particular model in the chart.
Clicking a particular model will hide/show that model in the chart.
At the bottom of the plot, you can select which models to show in the chart:
all the models, the dynamical models only, or the statistical models only.
Notes on the data
Only models producing forecasts on a monthly basis are included. This means that some models whose forecasts appear in the Experimental Long-Lead Forecast Bulletin (produced by COLA) do not appear in the table.
Once a CCSR/IRI ENSO probability forecast has been published, the results stand even if a model reports an error and changes their data.
When this happens we will update the plume with the model's correct values even though our forecast hasn't changed.
What this means is that our forecast is always the same, but the underlying data may be different from what we based our forecast on.
The SST anomaly forecasts are for the 3-month periods shown, and are for the Nino 3.4 region (120-170W, 5N-5S). Often, the anomalies are provided directly in a graph or a table by the respective forecasting centers for the Nino 3.4 region. In some cases, however, they are given for 1-month periods, for 3-month periods that skip some of the periods in the above table, and/or only for a region (or regions) other than Nino 3.4. In these cases, the following means are used to obtain the needed anomalies for the table:
- Temporal averaging
- Linear temporal interpolation
- Visual averaging of values on a contoured map
The anomalies shown are those with respect to the base period used to define the normals, which vary among the groups producing model forecasts. They have not been adjusted to anomalies with respect to a common base period. Discrepancies among the climatological SST resulting from differing base periods may be as high as a quarter of a degree C in the worst cases. Forecasters are encouraged to use the standard 1991-2020 period as the base period, or a period not very different from it.