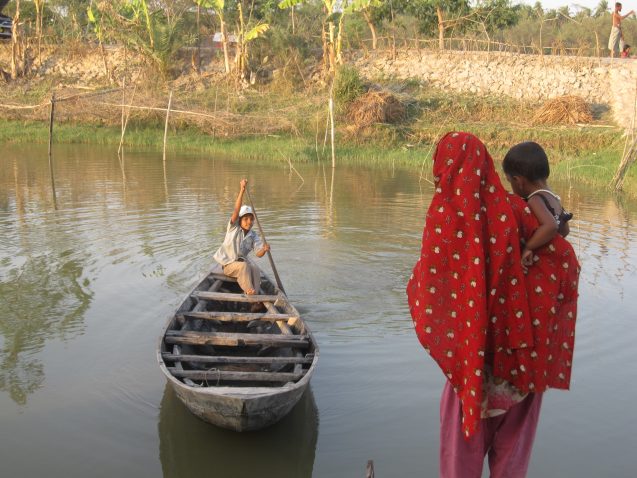
Populations Exposed to Flooding Growing Much Faster Than Thought – New Study
Originally adapted from a press release from Cloud to Street.
A new study indicates that the number of people affected by floods is growing much faster than scientists previously had thought, due both to increased inundation and migration of people into flood-prone areas. Using direct satellite observations rather than standard model estimates, the authors showed that from 2000–2018, populations in flood-prone regions grew 24 percent faster than elsewhere—more than 10 times previous estimates. The research was just published in the leading journal Nature.
The study “will help policymakers understand where flood impacts are changing and how best to adapt,“ said lead author Beth Tellman, a postdoctoral researcher at Columbia University’s International Research Institute for Climate and Society. It should “deepen our understanding of how land cover change, climate, and floods interact,” she said. Tellman developed most of the research as a PhD. student at Arizona State University and as chief science officer of the global flood-tracking company Cloud to Street.
Today, most flood maps rely on modeling that simulates floods based on ground data such as elevation and rainfall records. That includes those used by the U.S. Federal Emergency Management Agency. But these models have severe limitations, say the study authors; in fact, those maps often leave out recent incidents in areas not historically subject to flooding.

On the other hand, the new Global Flood Database used in the study allows researchers to directly observe the actual scope, impacts and trends of 21st-century flooding. Powered by twice-daily global satellite imaging, the database has information on 913 flood events in 169 countries since 2000.
The new study says that as many as 86 million people moved into observed flood regions from 2000-2015, resulting in a 24 percent increase in the proportion of populations exposed to floods. Some 2.23 million square kilometers (about 86,100 square miles) were flooded between 2000-2018, affecting between 255 million and 290 million people. Nearly 90 percent of the mapped flood events occurred in South and Southeast Asia, with the biggest basins—the Indus, Ganges-Brahmaputra, and Mekong—holding the largest numbers of people exposed. The satellite data uncovered previously unidentified increases in flood exposure in South Asia, southern Latin America, and the Middle East.
Most floods in the database were caused by heavy rainfall, followed by tropical storms or surges, followed by snow or ice melt, and then dam breaks. Despite representing less than 2 percent of floods, dam breaks had the highest increased incidence, 177 percent, in proportion of population exposed.
For example, in August 2008 the collapse of Nepal’s Koshi Barrage dam left over 3 million people homeless in the Indian state of Bihar. Repeated spillages of excess water in the last few years from Burkina Faso’s Bagre Dam have flooded thousands of hectares of agricultural land in neighboring Ghana, damaging or wiping out crops.
The researchers estimate that by 2030, climate and demographic changes will add 25 new countries to the 32 already experiencing increasing floods in the 21st century.
“We found that economic development and people moving into flood-prone areas is significantly increasing the number of people exposed to floods in those regions,” said study coauthor Jonathan Sullivan, a postdoctoral scientist at the University of Arizona. “Furthermore, increasing flood exposure is rooted in underlying conditions that give vulnerable populations no choice but to settle in flood zones.”
The authors say that information in the Global Flood Database can lead to immediately actionable lessons. For example, tracking population growth in flood-prone areas can help governments form adaptation strategies, and lead to speedier help for survivors of floods.
Other coauthors of the study are based at NASA, Google Earth Outreach, the University of Michigan, University of Colorado, University of Texas Austin, Dartmouth Flood Observatory, and the University of Washington. Funding was provided by Google and NASA.

You must be logged in to post a comment.