ENSO Forecast Navigation

ENSO Forecasts

ENSO Forecast

August 2026 Quick Look

Published: August 19, 2026

A monthly summary of the status of El Niño, La Niña, and the Southern Oscillation, or ENSO, based on the NINO3.4 index (120-170W, 5S-5N)

The 2026 El Niño event continues to intensify across the central-eastern equatorial Pacific. The traditional Niño 3.4 index shows a clear and sustained increase, with the most recent seasonal mean reaching +1.51 °C during May–July 2026 and the July monthly value increasing to +2.03 °C. The latest weekly Niño 3.4 index, centered on August 12, 2026, reached +2.7 °C. Together, these observations indicate that El Niño is strengthening further and evolving toward a very strong event.

Figures 1 ((the official CPC ENSO probability forecast) and 3 (the objective model-based CCSR/IRI ENSO probability forecast) are often quite similar. However, occasionally they may differ noticeably. There can be several possible reasons for differences. One is the human forecasters, using their experience and judgment, may disagree to some degree with the models, which may have known biases. Another reason is the models are not run at the same time that the forecasters make their assessment, so that the starting ENSO conditions may be slightly different between the two times. The charts on this Quick Look page are updated at two different times of the month, typically about a week apart, with the CCSR/IRI forecast run later. Also note that the CPC forecast starts on the previous season while the CCSR/IRI forecast starts on the current season.
Click on the for more information on each figure.

Historically Speaking

    El Niño and La Niña events tend to develop during the period Apr-Jun and they
  • Tend to reach their maximum strength during October - February
  • Typically persist for 9-12 months, though occasionally persisting for up to 2 years
  • Typically recur every 2 to 7 years

CCSR/IRI ENSO Forecast

CCSR/IRI Technical ENSO Update and Model-Based Probabilistic ENSO Forecast

Published: August 19, 2026

ENSO Current State: Ocean–Atmosphere Overview

The 2026 El Niño event continues to intensify across the central-eastern equatorial Pacific. The traditional Niño 3.4 index shows a clear and sustained increase, with the most recent seasonal mean reaching +1.51 °C during May–July 2026 and the July monthly value increasing to +2.03 °C. The latest weekly Niño 3.4 index, centered on August 12, 2026, reached +2.7 °C. Together, these observations indicate that El Niño is strengthening further and evolving toward a very strong event.

Oceanic and atmospheric indicators are becoming increasingly aligned, providing stronger evidence that the ongoing El Niño event will continue to intensify. On the atmospheric side, the Southern Oscillation Index (SOI) reached −29.1 in July 2026, while the latest 30-day SOI value, through August 17, remained strongly negative at −18.6. These persistently negative SOI values indicate a weakening of the Walker circulation, consistent with continued El Niño development. In addition, the Equatorial SOI reached −2.3 in July 2026, further indicating that the atmosphere is responding to the warming Pacific Ocean. This provides evidence that ocean–atmosphere coupling associated with El Niño is becoming increasingly established. During 8 July–6 August 2026, pronounced low-level (850-hPa) westerly wind anomalies extended across the western to east-central equatorial Pacific, while easterly anomalies dominated the eastern Pacific. This pattern is consistent with a weakening of the trade winds and continued strengthening of the El Niño circulation.  Consistent with the atmospheric response to the strengthening El Niño, below-average outgoing longwave radiation (OLR)—indicating enhanced convection and precipitation—was observed along the equator near the Date Line and across the east-central equatorial Pacific Ocean. In contrast, above-average OLR, indicating suppressed convection and precipitation, persisted over the Philippines, Indonesia, and Papua New Guinea.

Further evidence of El Niño’s strengthening comes from the subsurface ocean. A pronounced reservoir of anomalous heat has developed across the central–eastern equatorial Pacific, with temperatures at depths of approximately 50–150 m between 150°W and 80°W exceeding climatological values by more than 8 °C in some areas. This substantially increased subsurface heat content provides a strong source of energy for continued surface warming and further El Niño intensification, particularly if favorable ocean–atmosphere coupling persists. The magnitude of this subsurface warming is exceptional, raising the potential for a further increase in surface temperature anomalies during the boreal fall and early winter. If this evolution continues, the 2026 El Niño could emerge as one of the strongest events in the historical ENSO record.

ENSO Strength

Forecasts of ENSO strength are estimated through a consensus-based model counting approach using a set of Niño 3.4 sea surface temperature anomaly thresholds, to indicate weak, moderate, strong and very strong El Nino and La Nina categories.

The mid-August 2026 intensity assessment provides a striking indication of the exceptional strength of the ongoing El Niño event. The model ensemble points to a remarkably strong 2026 El Niño, with the vast majority of models forecasting a “very strong” El Niño (Niño 3.4 ≥ +2.0 °C) from ASO 2026 through DJF 2026–27. The signal peaks in OND 2026, when 25 of 26 models place Niño 3.4 in the very strong category, compared with 23 of 26 models in ASO, SON, and NDJ. OND 2026 is truly off the charts: although our current intensity classification stops at +2.0 °C, 15 models forecast Niño 3.4 SST anomalies reaching or exceeding +3.0 °C—well beyond our highest defined intensity category. Importantly, this is not simply a high-probability El Niño; the ensemble shows an unusually strong and consistent signal for an event of exceptional intensity. Even as the ensemble shifts toward weaker categories in early 2027, the persistence of strong-to-moderate El Niño conditions through MAM 2027 underscores the unusual magnitude and durability of the 2026 event. Taken together, the mid-August objective ENSO outlook points to a sustained, exceptionally strong El Niño, with little indication of a transition away from El Niño before spring 2027.


Notes:

The SST anomalies cited below are based on the NOAA Optimum Interpolation Sea Surface Temperature (OISSTv2)dataset. The climatology period is 1991–2020.

The primary metric used to monitor the El Niño–Southern Oscillation (ENSO) is the traditional Niño3.4 index (TONI), defined as the area-averaged sea surface temperature anomaly over the Niño3.4 region (5°S–5°N, 170°W–120°W).

According to the CCSR/IRI definition, El Niño conditions occur when monthly TONI exceeds +0.5 °C, while La Niña conditions occur when monthly TONI falls below −0.5 °C.

An ENSO “event” is considered established when the TONI threshold (±0.5 °C) persists for at least five consecutive overlapping 3-month seasons (e.g., SON, OND, NDJ, DJF, JFM).


CCSR/IRI Model Predictions of ENSO

CCSR/IRI ENSO Forecast Histogram

ENSO Forecast

CCSR/IRI ENSO Predictions Plume

Published: August 19, 2026

Note on interpreting model forecasts

The following graph and table show forecasts made by dynamical and statistical models for SST in the Nino 3.4 region for nine overlapping 3-month periods. Note that the expected skills of the models, based on historical performance, are not equal to one another. The skills also generally decrease as the lead time increases. Thirdly, forecasts made at some times of the year generally have higher skill than forecasts made at other times of the year--namely, they are better when made between June and December than when they are made between February and May. Differences among the forecasts of the models reflect both differences in model design, and actual uncertainty in the forecast of the possible future SST scenario.

CCSR/IRI Model Predictions of ENSO


CCSR/IRI Model Predictions of ENSO

List of Models Used

Discussion of Current Forecasts

ENSO Prediction Plume: Model-by-Model Outlook (Traditional Nino3.4 index)

The mid-August 2026 CCSR/IRI ENSO prediction plume has been updated with the latest model forecasts. The outlook shows strong agreement among the 26 participating models (15 dynamical and 11 statistical) that El Niño conditions will strengthen further during 2026 and persist into early 2027. All models maintain positive Niño3.4 anomalies throughout the forecast period, indicating a high level of confidence in the ongoing warming of the central and eastern tropical Pacific. Almost all dynamical and statistical models forecast Niño3.4 anomalies exceeding +2.0°C in Aug-Oct, indicative of a very strong event. Despite some uncertainty in the projected peak intensity, the forecast consensus is clear: a strong El Niño is highly likely to develop and persist through late 2026.


ENSO Probabilities

To generate the ENSO probability outlook, forecasts from all 26 participating models (14 dynamical and 12 statistical) are combined into an equally weighted multi-model average of Niño3.4 SST anomalies. A Gaussian error distribution is then applied to the ensemble-mean forecast, with its width determined by the expected forecast skill for the season and lead time. Higher forecast skill results in a narrower distribution and greater confidence, while lower skill produces a broader range of possible outcomes. Probabilities are calculated based on the likelihood of Niño3.4 SST anomalies falling within the standard ENSO thresholds: El Niño (≥ +0.5°C), ENSO-neutral (-0.5°C to +0.5°C), and La Niña (≤ -0.5°C). This methodology translates the multi-model forecast into probabilities for each ENSO category.

The August 2026 outlook strongly favors the persistence of El Niño through early 2027. El Niño probabilities remain at 100% from ASO 2026 through FMA 2027, followed by 97% in MAM 2027, before declining to 78% in AMJ 2027. This sharp decline in probability during boreal spring is consistent with the tendency for strong El Niño events to weaken rapidly following their peak.

Notably, no probability is assigned to either La Niña or ENSO-neutral conditions from ASO 2026 through FMA 2027, underscoring the near-certainty of continued El Niño conditions through the remainder of 2026 and into early 2027. With the boreal spring predictability barrier now behind us, the persistence signal is particularly robust: strong model consensus and the absence of competing ENSO states point to near certainty that El Niño will persist into early 2027. The accompanying probability plot summarizes the forecast evolution and the changing likelihood of each ENSO phase throughout the forecast period.

Summary of forecasts issued over last 22 months

The following interactive plot shows the model forecasts issued not only from the current month (as in the plot above), but also from the 21 months previous to this month. The observations are shown up to the most recently completed 3-month period. The plots allow comparison of plumes from the previous start times, or examination of the forecast behavior of a given model over time.
Hovering over any single model will highlight that particular model in the chart.
Clicking a particular model will hide/show that model in the chart.
At the bottom of the plot, you can select which models to show in the chart: all the models, the dynamical models only, or the statistical models only.


CCSR/IRI Model Predictions of ENSO

Notes on the data 

Only models producing forecasts on a monthly basis are included. This means that some models whose forecasts appear in the Experimental Long-Lead Forecast Bulletin (produced by COLA) do not appear in the table.

Once a CCSR/IRI ENSO probability forecast has been published, the results stand even if a model reports an error and changes their data. When this happens we will update the plume with the model's correct values even though our forecast hasn't changed. What this means is that our forecast is always the same, but the underlying data may be different from what we based our forecast on.

The SST anomaly forecasts are for the 3-month periods shown, and are for the Nino 3.4 region (120-170W, 5N-5S). Often, the anomalies are provided directly in a graph or a table by the respective forecasting centers for the Nino 3.4 region. In some cases, however, they are given for 1-month periods, for 3-month periods that skip some of the periods in the above table, and/or only for a region (or regions) other than Nino 3.4. In these cases, the following means are used to obtain the needed anomalies for the table:

  • Temporal averaging
  • Linear temporal interpolation
  • Visual averaging of values on a contoured map

The anomalies shown are those with respect to the base period used to define the normals, which vary among the groups producing model forecasts. They have not been adjusted to anomalies with respect to a common base period. Discrepancies among the climatological SST resulting from differing base periods may be as high as a quarter of a degree C in the worst cases. Forecasters are encouraged to use the standard 1991-2020 period as the base period, or a period not very different from it.

ENSO Forecast

Forecast Probability Distribution Based on the CCSR/IRI ENSO Prediction Plume

Published: August 19, 2026


The plots on this page show predictions of seasonal (3-month average) sea surface temperature (SST) anomaly in the Niño3.4 region in the east-central tropical Pacific (5°N-5°S, 120°-170°W), covering the nine overlapping seasons beginning with the current month. The predictions are based on the large (20+) set of dynamical and statistical models in the plume of model ENSO predictions.


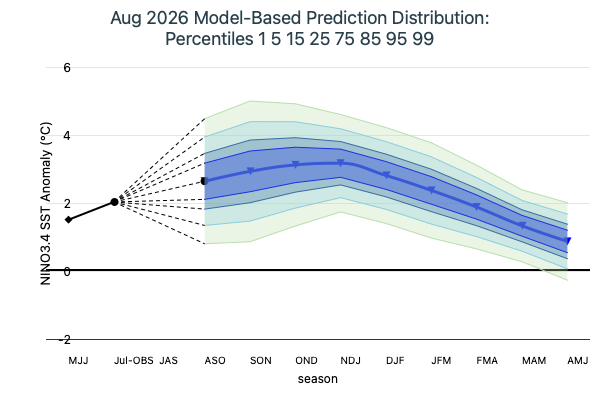
  • Model Based Prediction Percentiles Image

    Figure 5

    Predictions of ENSO are probabilistic. The ensemble mean prediction is only a best single guess. On either side of that prediction, there is a substantial uncertainty distribution, or error tolerance. The second plot (Figure 2) shows the estimated probability distribution of the predictions, showing a set of percentiles within that distribution for each lead time. The distribution is modeled as a normal (Gaussian) distribution, so that the overall mean forecast represents the center, or 50 percentile, in the distribution. The overall mean is formed using equal weighting among all models. On either side, other percentile values are shown symmetrically, ranging from 1 to 99 and including some intermediate percentiles (5 and 95, 15 and 85, and 25 and 75). The plot enables a user to estimate the probability of the Niño3.4 SST anomaly to be greater or less than some critical value, or within some interval. If, for example, the 85 percentile falls at 1.8° C above average, the probability of the SST exceeding 1.8° C can be estimated at 15%. Probabilities for exceeding or not exceeding values not exactly on percentile line can be roughly interpolated by eye. The overall width of the probability distribution is derived from the historical skill of the hindcasts of the models, from 1982 to present, for the specific forecast start time and lead time. This method of defining the probability distribution represents one of two general approaches, the other approach being a direct counting of ensemble members within each of the percentile bands. This second approach assumes that the ensemble spreads of the models are true representations of the uncertainty. Individual model spreads have often been found to be somwehate narrower than they should be, although in multi-model ensembles this tendency has been shown to be milder or even eliminated.

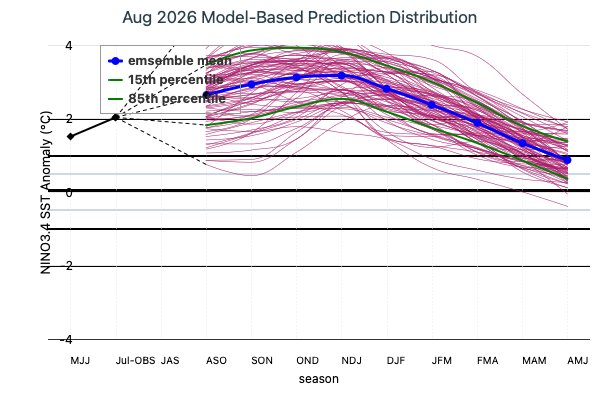
  • Model Based Prediction Distribution Image

    Figure 6

    Figure 6, sometimes called a spaghetti diagram, shows synthetically generated prediction scenarios that are equally likely. Here, 100 scenarios are shown; any number can be generated for such a diagram. Each scenario is produced using a random number generator, combined with knowledge of the mean forecast and its uncertainty, as well as the amount of persistence of anomalies. The degree of persistence of anomalies is based on the correlation of prediction errors from one lead time to another. In other words, the individual lines are designed to show the correct amount of persistence as expected in nature, rather than jumping around more randomly from one lead time to the next. The uncertainty and persistence statistics are based on the set of 7 NMME (North American Multimodel Ensemble) models, as it is assumed that these statistics are approximately applicable to all of the models. Sometimes the “spaghetti density” may appear asymmetric about the mean of all the forecasts or outside of the 85 and 15 percentile lines. This is purely sampling variability, and would not occur if many thousands of such lines were plotted. But with that many lines, most of the plot would be too crowded to get a sense of the behavior of the lines near the center of the distribution. The main purpose of the diagram is to serve users who want to assess realistic individual scenarios of ENSO behavior rather than statistical summaries of the forecast like the percentiles shown in the second plot.

IOD Forecast

Published: August 19, 2026

Note: The Dipole Mode Index is calculated based on the ERSSTv5 data. To account for evolving background conditions and long-term warming, SST anomalies were calculated relative to a sliding monthly climatology. For each month in the time series, the climatology was computed as the mean SST for that calendar month over the prior 30 years. The Dipole Mode Index (DMI) is then defined as the difference in sea surface temperature anomalies between the western equatorial Indian Ocean (50°E–70°E, 10°S–10°N) and the southeastern equatorial Indian Ocean (90°E–110°E, 10°S–0°), and is used to quantify the strength and phase of the Indian Ocean Dipole (IOD).

Current Conditions

In July 2026, the observed Dipole Mode Index was +0.11 °C, indicating neutral IOD conditions across the Indian Ocean. According to the CCSR/IRI’s criteria for defining positive and negative Indian Ocean Dipole (IOD) events, a positive IOD phase is defined when the DMI exceeds +0.4 °C, and a negative IOD when it falls below −0.4 °C. The IOD is considered inactive (neutral) when the DMI lies between −0.4 °C and +0.4 °C.

Model-Based IOD Outlook: Deterministic Forecasts from the NMME

Forecasts from the latest set of operational models in the North American Multi-Model Ensemble (NMME) project are used to construct deterministic IOD forecasts from each individual model using its ensemble mean DMI to form an IOD forecast plume. The IOD plume plot shows the latest set of predictions (based on August 2026 initialization) from CESM1, CFSv2, CanESM5, GEM-NEMO, and NASA along with their equally weighted multi-model mean (MME). Observations show that the DMI (black line) remained in a neutral state from January through April 2026, turned negative in May and June, and returned to neutral conditions in July 2026, as reflected by the observed DMI values. Forecasts indicate that the IOD is expected to transition to positive conditions in August 2026 and remain strongly positive through September–December 2026, as indicated by both the individual model forecasts and their multi-model mean (thick red line). During January and February 2027, the forecasts indicate a return toward neutral IOD conditions. The emergence of a positive IOD closely accompanies the exceptional evolution of El Niño, consistent with the well-documented tendency for these two climate modes to co-occur, while recognizing that they can also develop independently.

Probabilistic IOD Forecasts from the NMME

Based on August 2026 initialization data, the model-based probabilistic forecast of the Indian Ocean Dipole was generated by CCSR/IRI to assess potential phase developments. Probabilities are computed using an ensemble-member counting method, where all ensemble members from the contributing models combined, are pooled to determine the likelihood of a negative, neutral, or positive IOD phase for the upcoming months. Climatological probabilities for each IOD phase, based on historical data, are shown as dotted lines for reference. In August 2026, positive IOD conditions become dominant, with the probability of neutral conditions dropping sharply. The positive IOD signal strengthens and remains dominant through September–December 2026, while the probability of neutral conditions stays below 20%. By January 2027, the forecast shifts back toward neutral conditions, although only slightly ahead of positive IOD. By February 2027, neutral conditions become firmly favored, with a probability of about 60%. Overall, the forecast strongly favors the development and persistence of a positive IOD from August through December 2026, followed by a transition back toward neutral conditions in early 2027.

Figure: IOD Plume and Probabilities (August, 2026).
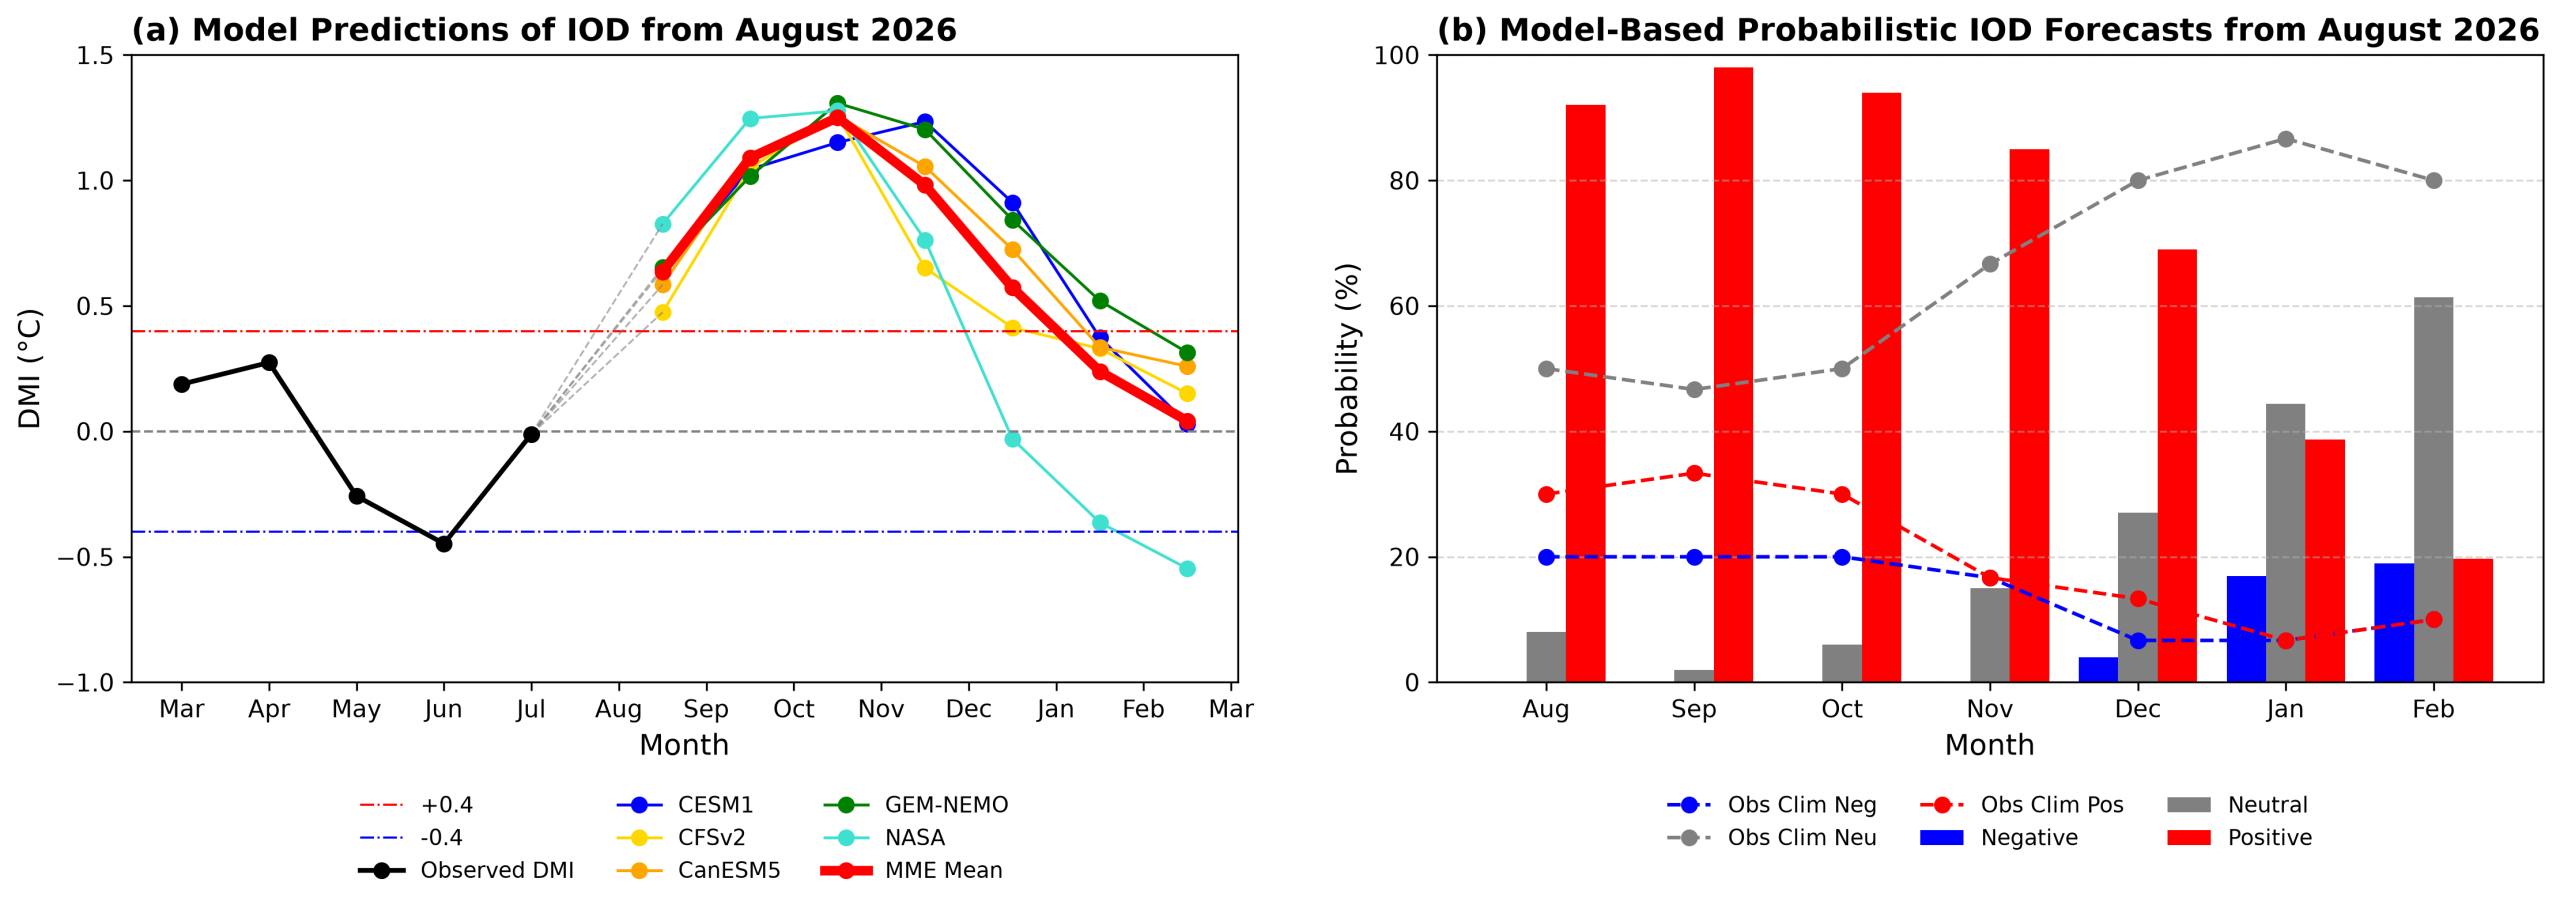

August 19, 2026 IOD Model Based Forecast
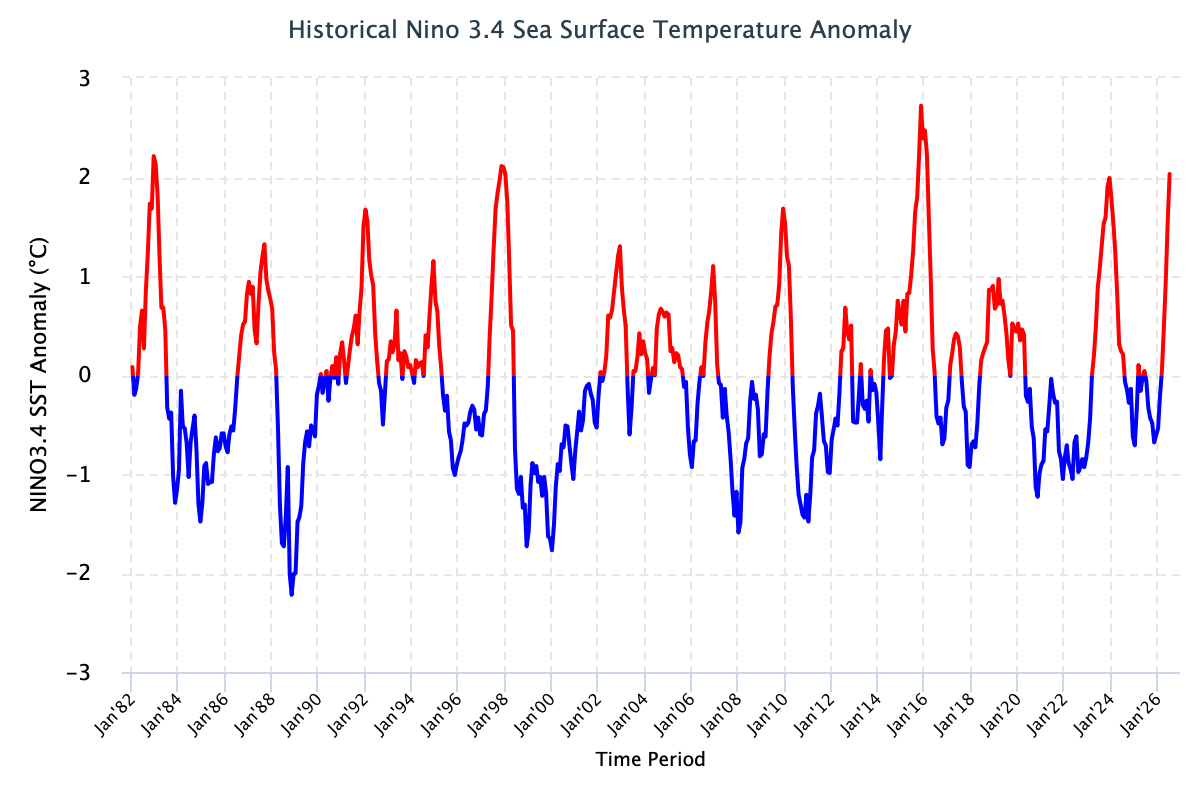
Historical SST Anomalies Image

Contact Us

Please contact us for opportunities to collaborate on research using the CCSR/IRI ENSO Forecasts. We are always interested in collaborating with researchers and organizations to advance our understanding of ENSO and its impacts. Please contact us at products@iri.columbia.edu or fill out this form, and we can get back to you regarding your interests:

References

Real-time ENSO forecast skill evaluated over the last two decades, with focus on the onset of ENSO events. Ehsan, M.A., L’Heureux, M.L., Tippett, M.K., Robertson, A.W, Turmelle, J.P., npj Clim Atmos Sci, 2024.

The CCSR/IRI ENSO forecast is released on the 19th of each month. If the 19th falls on a weekend or holiday, it is released on the closest business day.

We are no longer providing forecast data. If you would like to collaborate with us on ENSO research, please fill out this form, and we can get back to you regarding your interests:
Request to Collaborate with the CCSR/IRI Forecast Team.

All data from this website is covered under the Creative Commons Attribution 4.0 License.
Please reference:
ENSO Forecast Data © 2002-2026 by International Research Institute for Climate and Society is licensed under Creative Commons Attribution 4.0 International