April Climate Briefing: La Niña Transitions Out, Neutral Next
Read our ENSO Essentials & Impacts pages for more about El Niño and La Niña.
Tony Barnston provides an overview of the briefing
What’s New
Sea-surface temperature (SST) anomalies in the equatorial Pacific Ocean have continued to warm since last month’s briefing, crossing from La Niña to neutral territory over the last few weeks. Weekly SST anomalies in the area of the Pacific that helps define El Niño and La Niña events, called the Nino3.4 region, averaged -0.28ºC over the last four weeks, which falls in the category of a neutral ENSO state. For the previous four weeks, the Nino3.4 anomaly was -0.73ºC.
Sub-surface ocean temperatures have also continued to warm (see second figure below). While such subsurface changes don’t always translate to temperature shifts at the surface, the latest model runs are predicting the warmth will rise to the surface level in the coming months (more on those below).
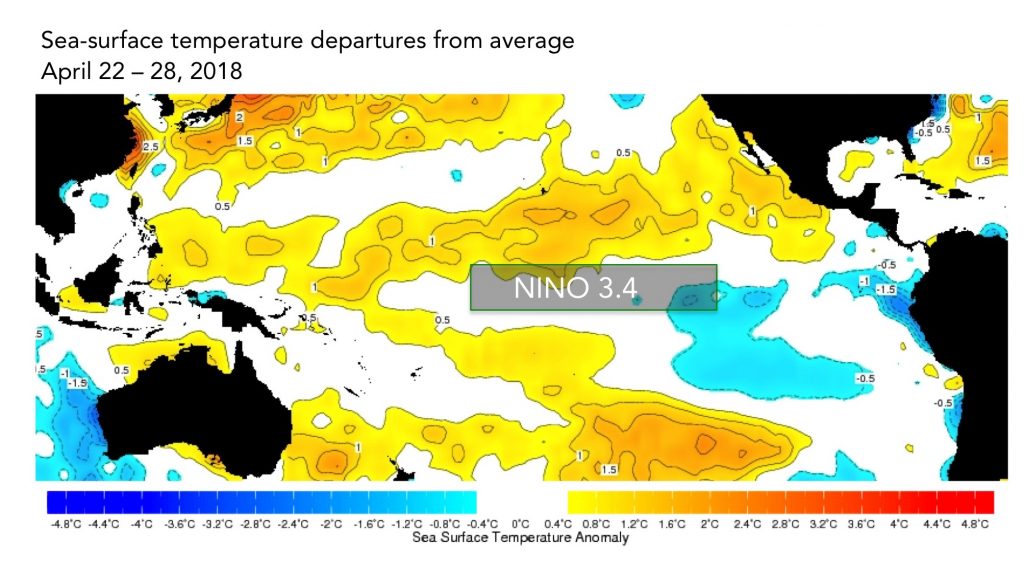
The sea-surface temperatures in the Nino3.4 region (approximated here) serve as a primary metric of El Niño and La Niña conditions. Data from the IRI Data Library. Image: IRI/Elisabeth Gawthrop
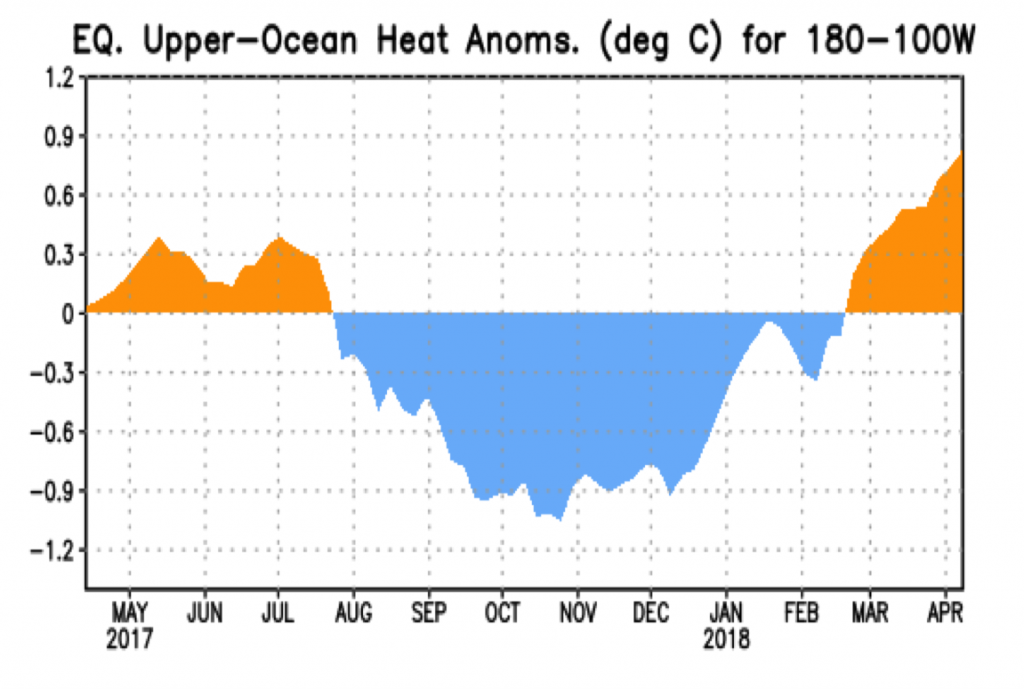
Temperature anomalies taken of the upper sub-surface ocean in the equatorial Pacific. Measurement taken from 180-100ºW, and from the surface to 300 meters deep. Source: NOAA.
Despite the warming ocean temperatures, wind patterns have remained stubbornly La Niña-like. “A curious resistance to the demise of the event,” said Barnston at the briefing. The ENSO alert level from the IRI and the National Oceanic and Atmospheric Administration’s Climate Prediction Center remains at a La Niña Advisory, which was initially issued in November, but Barnston said the advisory is likely to be downgraded next month.
ENSO Forecasts
To predict ENSO conditions, computers model the SSTs in the Nino3.4 region over the next several months. The plume graph below shows the outputs of these models, some of which use equations based on our physical understanding of the system (called dynamical models), and some of which use statistics, based on the long record of historical observations. The current forecasts are still behind what scientists call the spring predictability barrier – a time when it’s notoriously difficult for models to do a good job of forecasting upcoming conditions. Uncertainty for the forecasts this month and next is therefore high.
The models in this month’s forecast predict SST anomalies in Nino3.4 to gradually warm through the year. While last month the models reached only just above the +0.5ºC El Niño SST anomaly threshold during the forecast period, the means of both types of models are now topping out around +0.8ºC by early 2019. Dynamical models are usually more bullish on El Niño than statistical models are, said Barnston, but this time it’s the statistical models calling for faster warming. The mean of the statistical models reaches the +0.5ºC mark in the July-September season.
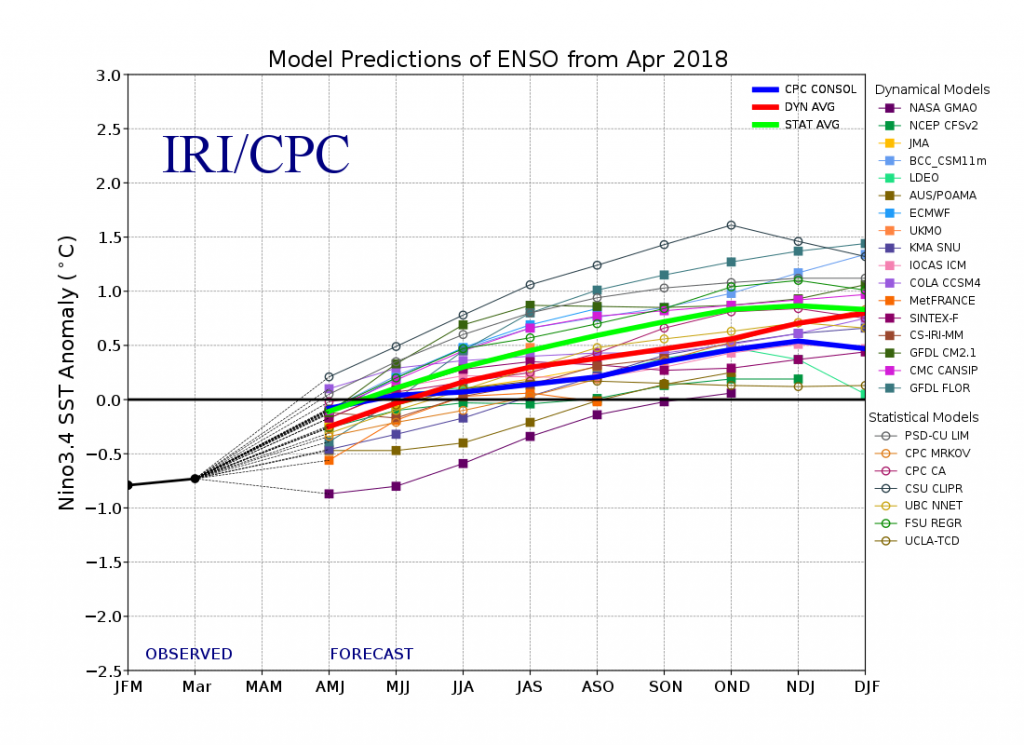
This graph shows forecasts made by dynamical and statistical models for SST in the Nino 3.4 region for nine overlapping 3-month periods. Note that the expected skills of the models, based on historical performance, are not equal to one another.
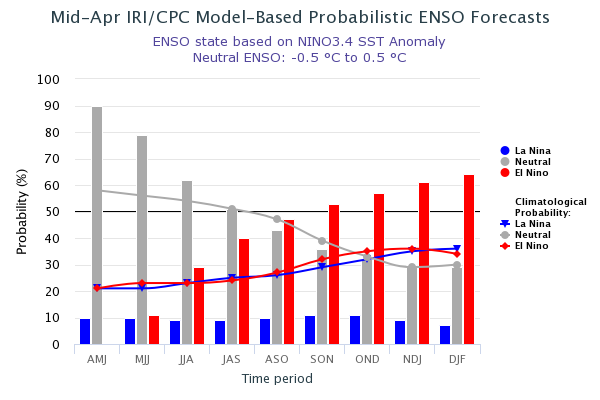
The IRI/CPC probabilistic ENSO forecast issued mid-April 2018. Note that bars indicate likelihood of El Niño occurring, not its potential strength. Unlike the official ENSO forecast issued at the beginning of each month, IRI and CPC issue this updated forecast based solely on model outputs. The official forecast, available at http://1.usa.gov/1j9gA8b, also incorporates human judgement.
Based on the model outputs, odds for neutral ENSO conditions dominate at 90% for the current April – June season. Neutral conditions remain the most likely ENSO state through the northern hemisphere summer. In the August – October season, El Niño edges out neutral as the most likely condition, but chances are still under 50% and uncertainty is high.
ENSO in context: Resource page on climate variability
The official probabilistic forecast issued by CPC and IRI in early April indicates similar overall trends in ENSO probabilities, but it is more conservative in predicting El Niño in the later months. This early-April forecast uses human judgement in addition to model output, while the mid-month forecast relies solely on model output. More on the difference between these forecasts in this IRI Medium post.
IRI’s Global Seasonal Forecasts
Each month, IRI issues seasonal climate forecasts for the entire globe. These forecasts take into account the latest model outputs and indicate which areas are more likely to see above- or below-normal temperatures and precipitation.
Our seasonal precipitation forecasts until the end of the year, show tell tale signs of El Niño, mimicking the forecast probabilities. But forget not the Spring Predictability Barrier, Tony warns! We'll get a more accurate sense starting in May. #IRIforecast pic.twitter.com/9SGWytXQz9
— IRI (@climatesociety) April 19, 2018
For the upcoming May – July season, odds are moderately tipped in favor of below-normal rainfall across Indonesia, central Asia, Chile, northeastern Brazil, Central America and the Caribbean. Areas with some chance of above normal precipitation include the Phillipines, Alaska, eastern India and the Himalayas.
All forecast maps, including temperature in addition to precipitation, and including a description of the methodologies, are available on our seasonal forecast page.
Learn more about El Niño and La Niña on our ENSO resources page, and sign up here to get notified when the next forecast is issued. In the meantime, check out #IRIforecast.
You must be logged in to post a comment.