|
IRI Climate Digest
March 2001
Special Summaries
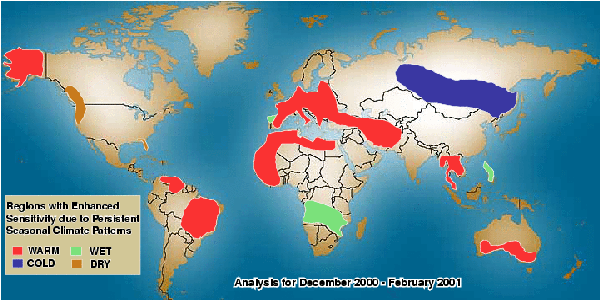
Regions of Enhanced Sensitivity Due to Persistent Climate Patterns in Dec-Jan-Feb 2000/2001

The above schematic is derived from the analysis provided below:
3 Month Precipitation Persistence


Areas colored in green (brown) indicate regions where monthly rainfall
was in the top (bottom) 20% of the (1979-present) observational record
with lighter (darker) shading indicating where this condition was met for
two (three) of the past three months. Colored regions indicate areas
with increased vulnerability to future climate stress. Contours are
climatological precipitation for the period in mm per month.
3 Month Temperature Persistence


Areas colored in red (blue) indicate regions where monthly temperature
was in the top (bottom) 20% of the observational record with lighter (darker)
shading indicating where this condition was met for two (three) of the
past three months. Shaded regions indicate areas with increased vulnerability
to future climate stress.
Contents |
Special |
Impacts |
Climate |
Forecast
|