Skill maps
Select the desired set of skill maps to plot by editing the list below.
These are calculated over the retroactive forecast period,
i.e. the portion of the hindcast period after lti.
# Skill scores loop
plt.rcParams.update({'font.size': 10})
for ime in ('Pearson','Spearman','2AFC','RocAbove','RocBelow','Ignorance','RPSS','GROC'):
    pltmap(ime,wlo2,elo2,sla2,nla2,fprefix,mpref,training_season, mon, fday, nwk, wk)
    plt.savefig(('figures/Skill-'+model+'-'+obs+'-'+MOS+'-' + ime + '.pdf'), dpi=300)
    plt.show()
Which skill scores to choose?
Each score measures a particular attribute of forecast performace. Multiple scores provide an indication of robustness; the forecasts should be skillful according to a range of scores.
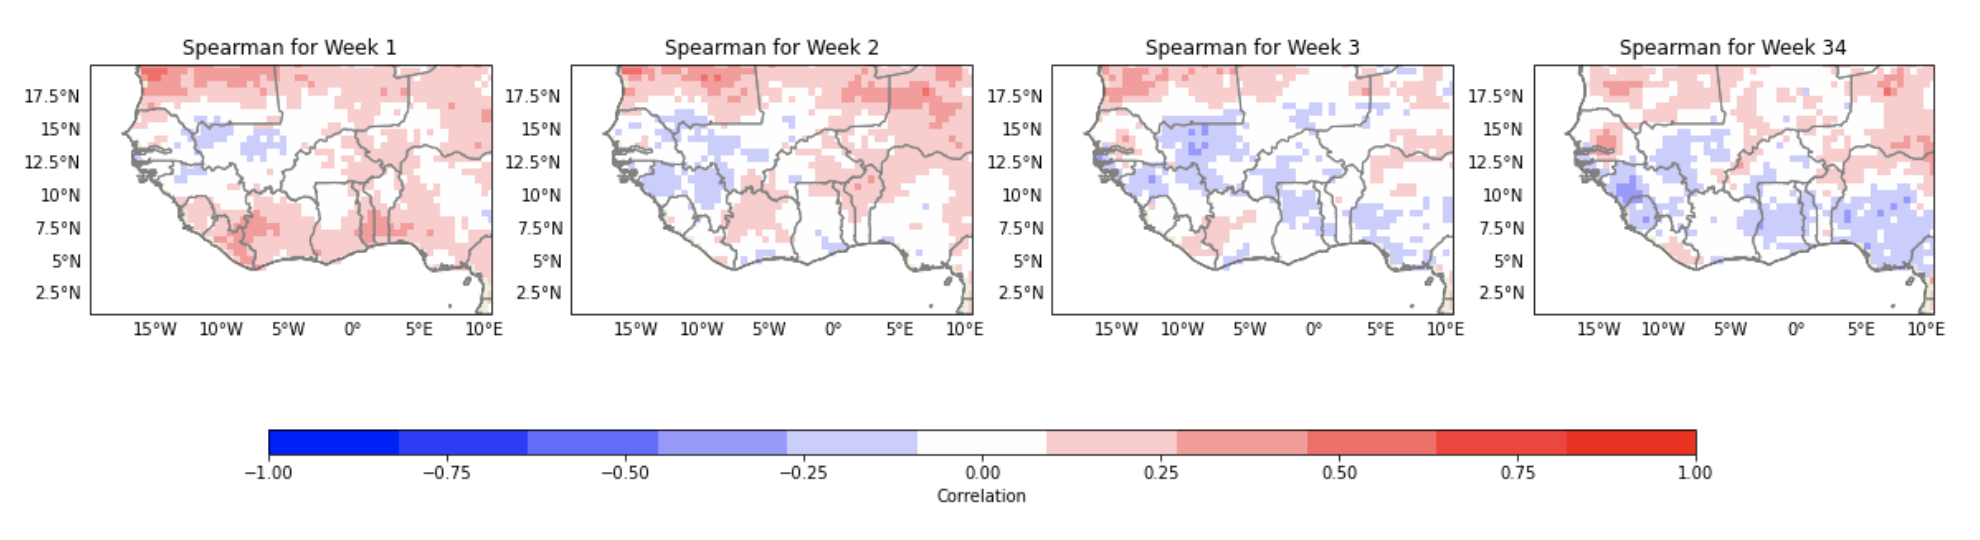
Spearman correlation at different lead times, from the ECMMF model for the May–July season, via CCA.
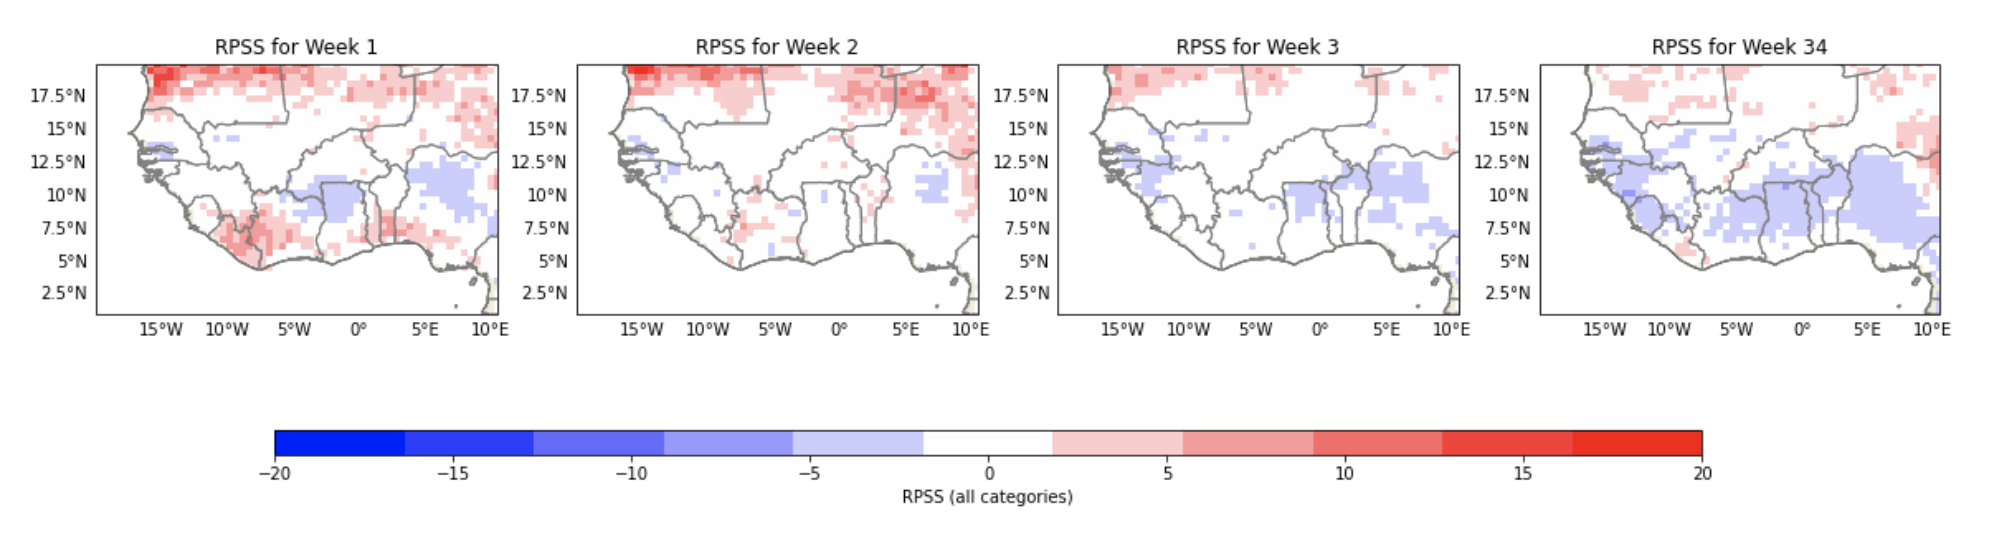
Here are the corresponding maps for the Ranked Probability Skill Score (RPSS).
Note
The spatial patterns of Spearman correlation and RPSS are similar, with positive skill along the Guinea Coast. RPSS is generally non-negative, indicative of well-calibrated forecasts.
Over what period are these scores calculated?
If the hindcast period used here is May-July 2000–2018, the total number of weekly hindcast starts ntrain = 19 years x 3 months x 4 weeks ~ 228. Then if the length of the initial training period is chosen to be lit=110 (about 110/12 ~ 9 MJJ seasons), this yields a retroactive forecast period of 11 MJJ seasons, 2009–2018, over which the scores are calculated.
Skill of the NOAA GEFSv12 model
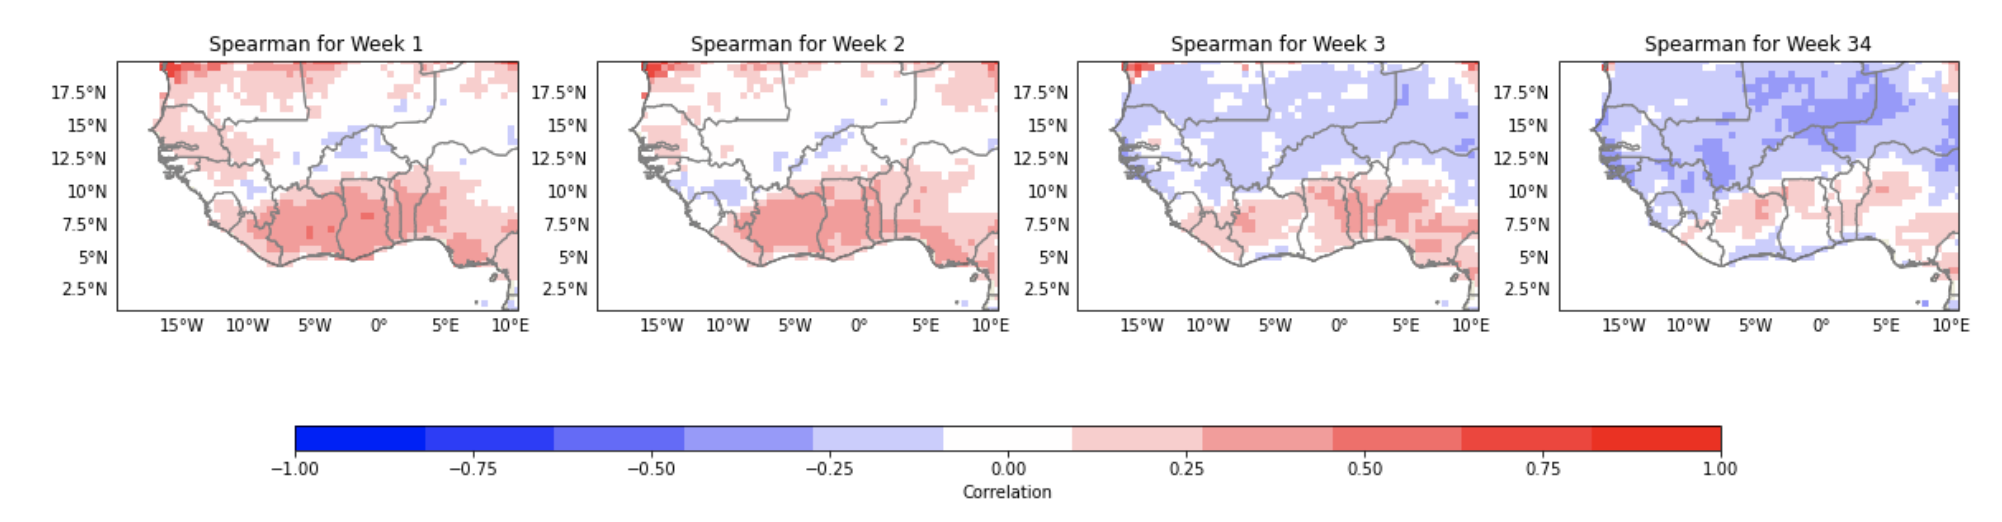
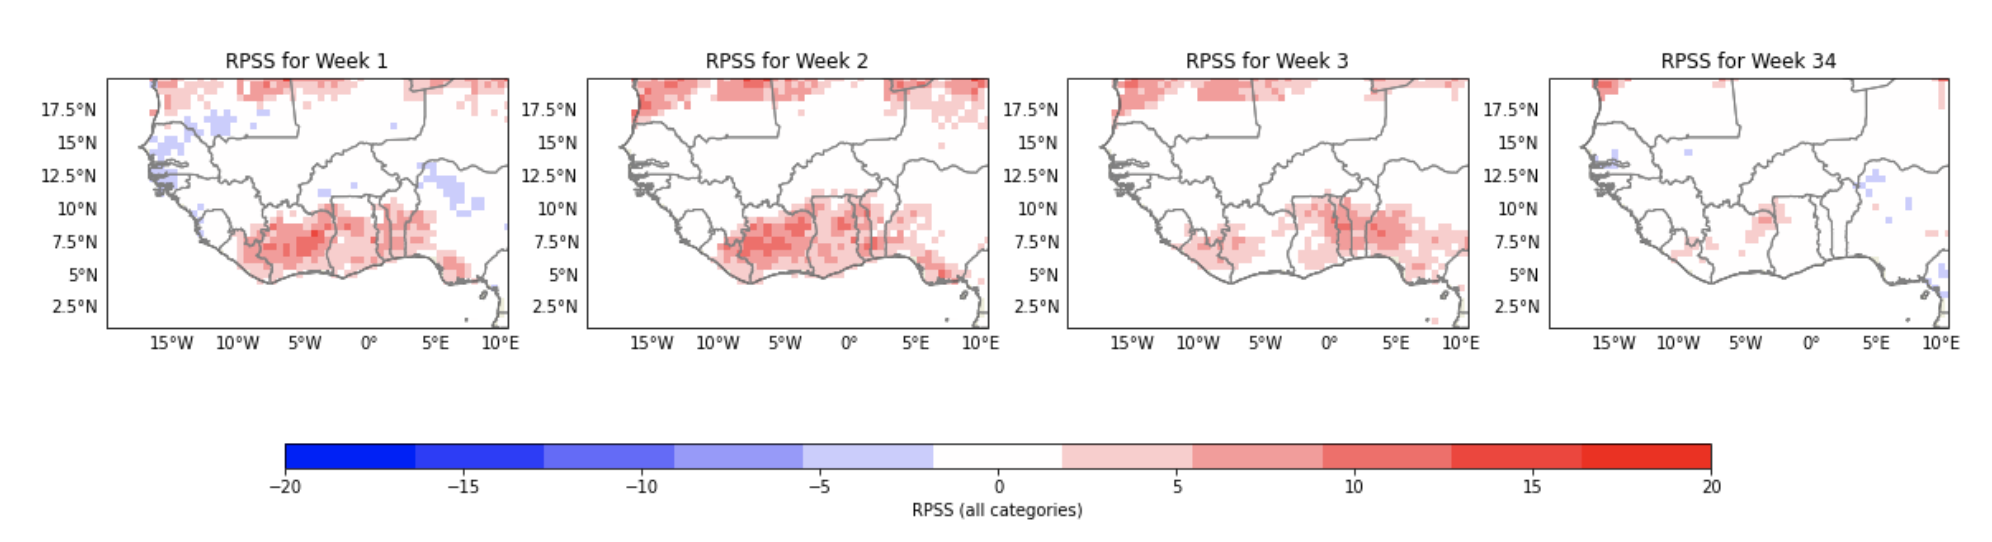
PyCPT allows the performance of different subseasonal systems to be quickly intercompared. The maps below show the Spearman correlation and RPSS from the NOAA GEFSv12 model (one of the SubX models), indicating similar patterns of skill at one-week lead (and thus weather predictability during the May–July season), but lower skill levels, especially at longer lead times.
Spearman correlation (top) and Ranked Probability Skill Score (RPSS) (bottom) at different lead times, from the GEFSv12 model for the May–July season, via CCA.