|
IRI Climate Digest
March 2006
February Global Climate Summary
Climatological Background
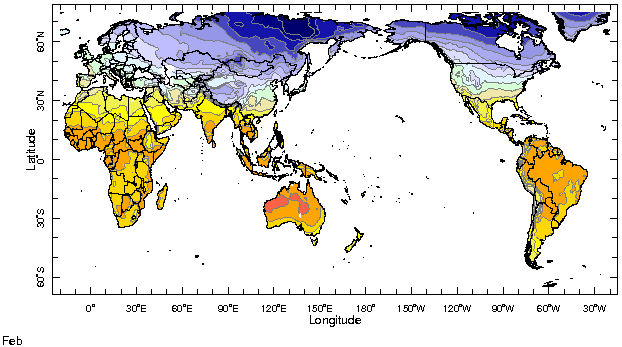
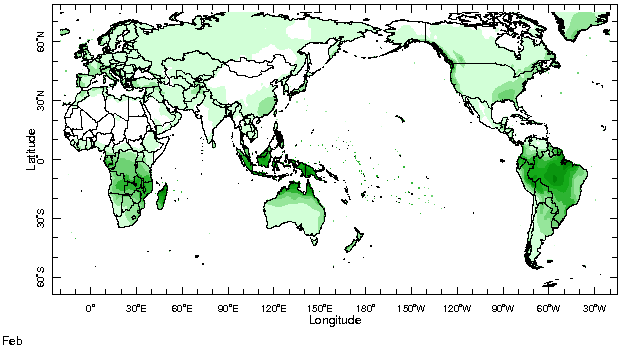
In February, the sun is retreating from its southernmost excursion (23 degrees south) on its approach toward the equator in mid-March (the equinox). It is the end of summer in the Southern Hemisphere, and the monsoon systems typically achieve their maximum intensity in Africa, Australia, Indonesia, and South America. Winter in the Northern Hemisphere generally peaks, with the north-south temperature differences beginning to drive the mid-latitude jet stream northward.
Monthly Mean Temperature (1961-1990), data from the Climate Research
Unit, University of East Anglia


Monthly Mean Precipitation (1961-1990), data from the Climate Research
Unit, University of East Anglia


Temperatures
The northern hemisphere continents witnessed a spectacular change in surface temperature during the course of February. Temperatures during January were well below average over Eurasia, and above average over North America. In February, Eurasia warmed up considerably, while North America cooled down, relative to climatology. Of particular note were the conditions in central south-west Asia, where temperatures were 4-8°C above average across much of the region. Elsewhere, warmer-than-average surface temperatures persisted over much of tropical Africa, the tropical Americas, and eastern Australia.
Temperature Difference from the 1961-1990 mean, with data
from NCEP Climate Prediction Center, CAMS.


Precipitation
The precipitation pattern in the tropics partially conformed to the cooling of the central equatorial Pacific. Precipitation was below average in the central equatorial Pacific, across the southern tier of North America, and in southeastern South America. It was above average in parts of Southeast Asia, most notably in the Philippines, and parts of Indonesia. It was also above average in western and central southern Africa, and below average in eastern and southern Africa. Regions around the Mediterranean Sea, including Northwest Africa experienced above-average precipitation, while in northern Europe precipitation was deficient, compared to normal.
Precipitation Difference from 1979-2000 mean, with data
from NCEP Climate Prediction Center, CAMS-OPI.


Oceanic Conditions
Anomalously cool surface conditions persisted in the central equatorial Pacific, flanked by abnormally high temperatures at subtropical latitudes. Anomalies of opposite sign on east and west coasts of Australia, visible since September-October, persisted through February. Relatively warm conditions in the North Atlantic, including the high latitudes as well as the tropics, were reduced by the action of anomalously strong winds. Elongated, parallel areas of unusually warm/cool waters oriented northwest to southeast characterized the western parts of the South Atlantic and Indian Oceans.
Monthly Sea Surface Temperature Difference from the 1971-2000 mean,
with data from the Environmental Modeling Center, NCEP/NOAA.


Contents |
Special |
Impacts |
Climate |
Forecast
|

