|
IRI Climate Digest
February 2005
January Global Climate Summary
Climatological Background
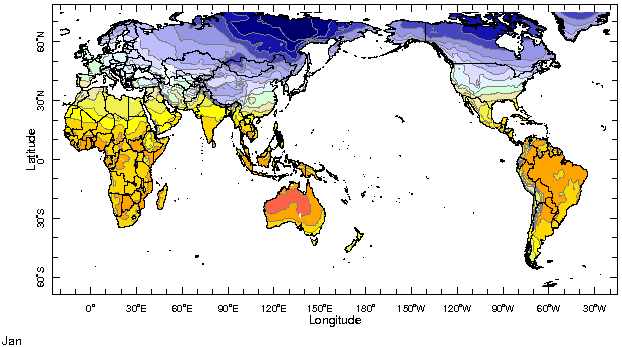
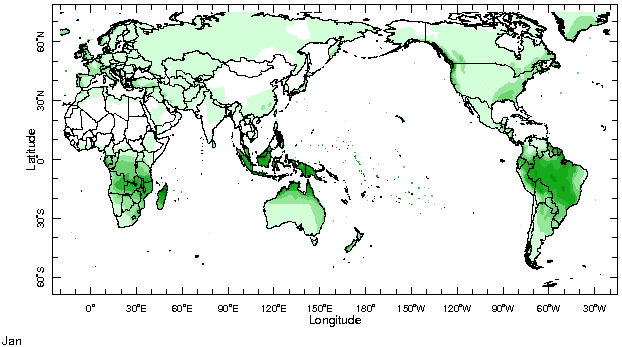
In January, mid-summer monsoon systems are usually at their peak in the Southern Hemisphere over southern Africa, Australia and Indonesia, and South America. In the Northern Hemisphere deep winter has set in, with strong north-south temperature differences driving the mid-latitude jet stream and storm systems.
Monthly Mean Temperature (1961-1990), data from the Climate Research
Unit, University of East Anglia


Monthly Mean Precipitation (1961-1990), data from the Climate Research
Unit, University of East Anglia


Temperatures
Highlights
In the mid and high latitudes of the Northern Hemisphere, warmer-than-average conditions prevailed over Europe and Asia, a marked change from the previous month. Warmer-than-average conditions also prevailed over southern Africa, tropical South America, the southern US, and Mexico, while colder-than-average conditions affected New Zealand and Canada, especially the eastern provinces.
Temperature Difference from the 1961-1990 mean, with data
from NCEP Climate Prediction Center, CAMS.


Precipitation
Highlights
Deep convection in the equatorial Pacific Ocean in January by and large remained confined to an area west of the dateline, a clear sign of the weakness of the coupling between ocean and atmosphere that has characterized warm equatorial Pacific conditions this past year. Despite this weakness, many regions of the world typically affected by ENSO experienced climate anomalies normally associated with a "typical" warm ENSO event. In January these included drier-than-average conditions over tropical South America south of the equator, the Greater Antilles (Cuba impact report), southern Africa, and the maritime continent, with the exception of southern Sumatra and western Java in Indonesia (Indonesia impact report). Unlike in a "typical" warm ENSO event, the southeastern U.S. was drier than average, while northern South America (Impact report) and parts of Central America (Costa Rica and Panama impact report) and the Caribbean were wetter than average. Sections of the U.S., most notably the southwest, and Canada also experienced anomalously wet conditions. In the Indian Ocean, precipitation was above average along the eastern coast of Sri Lanka (data for Batticaloa, Sri Lanka, from NOAA/CPC) and in Aceh province of Sumatra, two locations hard hit by the tsunami of December 26, 2004. Drier-than-average conditions prevailed across the southern Indian Ocean, and into southeastern southern Africa, while southwestern southern Africa experienced anomalously wet conditions. Anomalous wet conditions also prevailed in Burundi, Rwanda and surrounding bordering regions with Uganda, Tanzania and DR Congo (Burundi, DRC impact report).
Precipitation Difference from 1979-1995 mean, with data
from NCEP Climate Prediction Center, CAMS-OPI.


Oceanic Conditions
The equatorial oceans persisted in their warmer-than-average state, especially the western and central equatorial Pacific, the eastern equatorial Indian, and eastern equatorial Atlantic basins. Conversely, east of the dateline the equatorial Pacific cooled considerably, following a strengthening of the trade winds noticeable between 120°W and the coasts of Central and South America - another sign of the weakness of the ocean-atmosphere coupling characteristic of current warm conditions. See the ENSO Quick Look and the IRI ENSO Update for more information. Warm anomalies persisted in the southern Atlantic and Indian Oceans around southern Africa, despite having significantly cooled from the previous month. Alternating regions of warm and cold SST anomalies characterized the mid-latitudes of the Southern Hemisphere. Well-organized centers of above-average temperatures characterized the central North Pacific and North Atlantic basins.
Monthly Sea Surface Temperature Difference from the 1971-2000 mean,
with data from the Environmental Modeling Center, NCEP/NOAA.


Contents |
Special |
Impacts |
Climate |
Forecast
|

